How to Use Volume Profile to Read Market Context (VAH/VAL Rules + Day Types)
Let’s be honest—this is where most traders get hurt:
❌ They don’t know when to ride the move… and when to fade the range.
❌ They try to trend-trade a balanced day or scalp a breakout that was never coming.
There are plenty of ways to tell whether the day wants to range or trend, we respect them all. But here’s the quiet constant many pros rely on:
👉 The volume distribution tells the story.
And the clearest way to see it?
Volume Profile.
It’s not the only method, but it’s one you can trust and lean on. Most professional traders use it to read the context.
What Volume Profile actually shows (no fluff)
- 📌 Where price lingered and did business
- 📌 Where real transactions happened
- 📌 Where buyers and sellers said “this is fair” — a.k.a. value
That’s your balance. That’s your range.
Everything outside of it?
Imbalance. The fuel for movement.
📉 Volume Profile reveals where the market has settled…
📈 and where it’s still searching for a fair price.
Volumes are present in any business – Volume Profile Analogy to real world example
Imagine a brand selling premium headphones.
✅ For months, the “normal” price is $200–$250. Buyers are happy. Sellers are happy. That’s the value area.
Then something breaks. Literally. ⚠️ Ear pads fall apart. Buyers don’t see the same value. Price slips to $130–$150. That’s the new accepted value—for now.
They fix the defect. Improve the design. Better materials. ✨
What happens? The market re-evaluates. Buyers are willing to pay up again. Price migrates back into $200–$250, the prior high-volume zone.
That’s markets. Shoes, furniture, electronics, futures – it’s all the same. We’re forever searching for “fair.” Volume Profile just puts that search on a chart.
Volume Profile Glossary: VAH, VAL, POC, Balance vs Imbalance
Quick definitions so we’re speaking the same language before we trade:
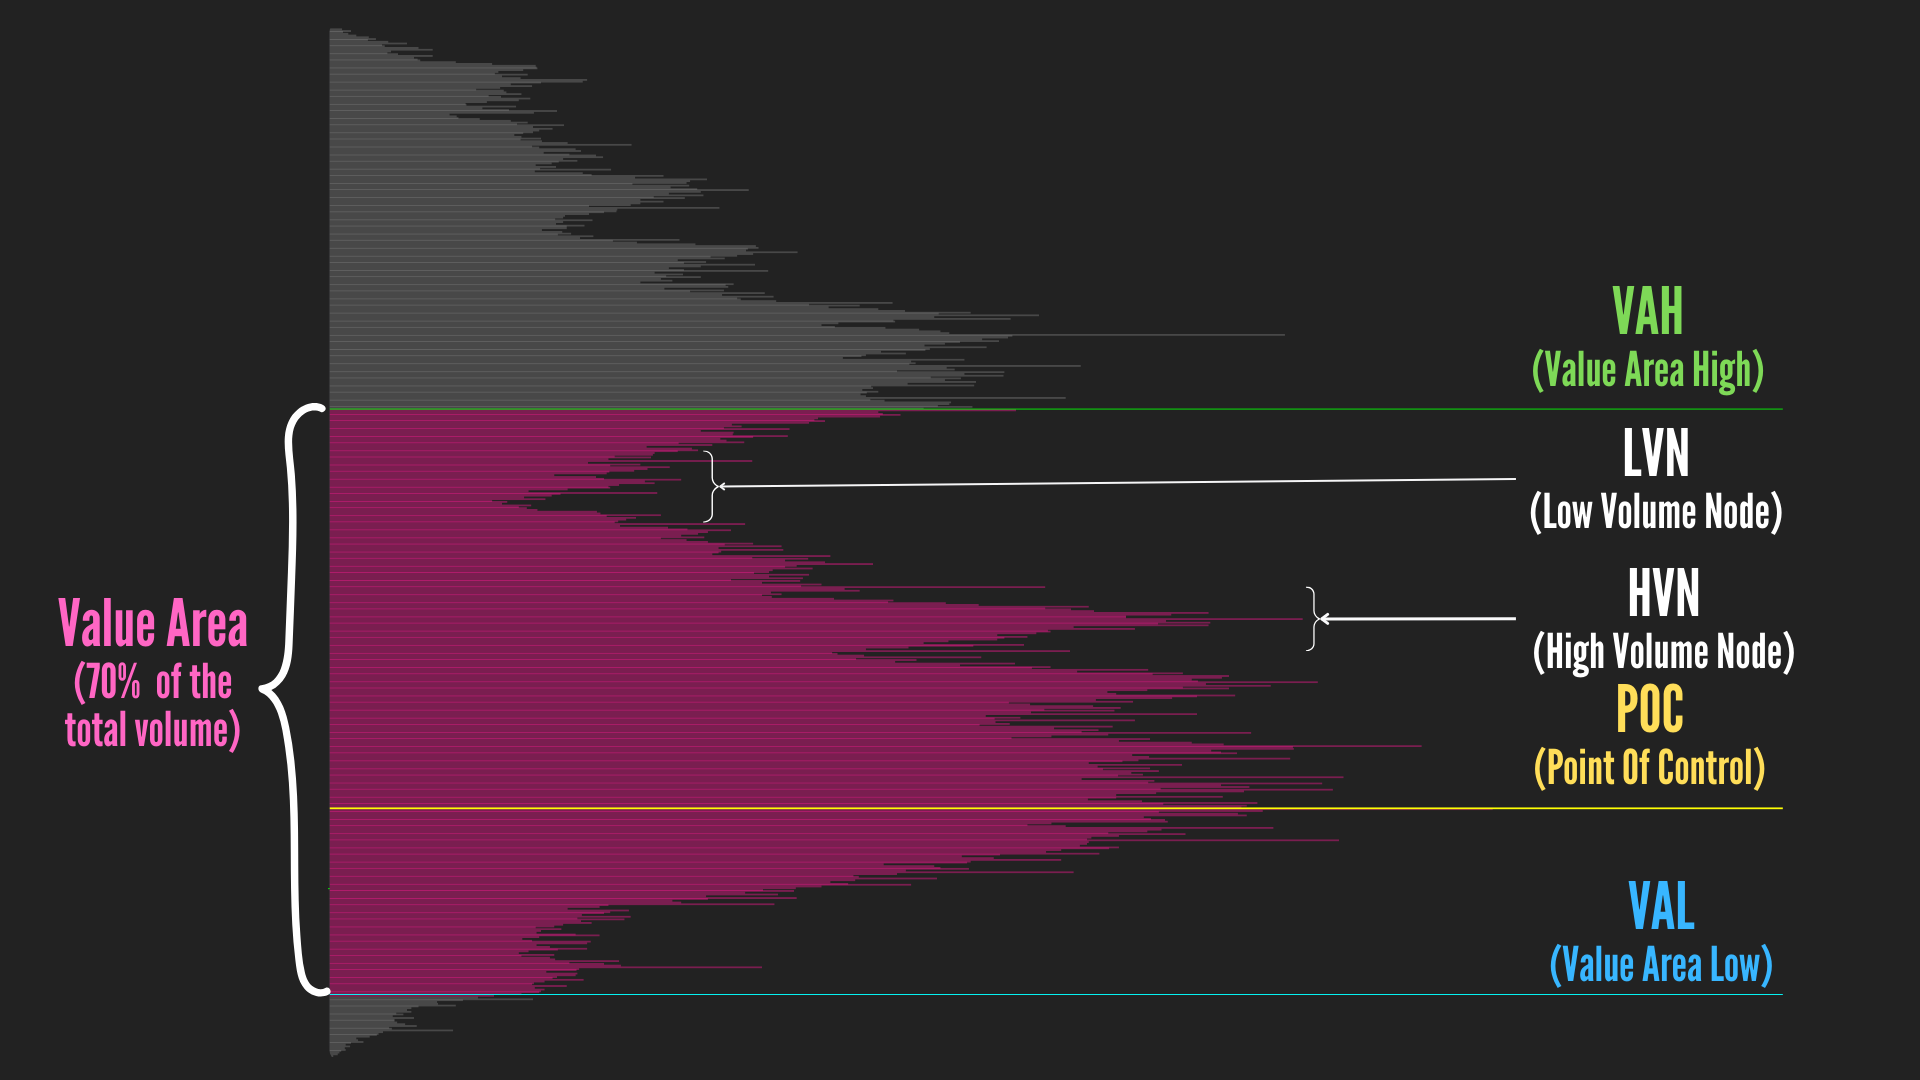
- VAH / VAL (Value Area High / Low)
- The upper and lower boundaries of the value area—about 70% of all traded volume. Use VAH/VAL to frame range extremes and judge acceptance vs rejection.
- POC (Point of Control)
- The single price with the highest traded volume – the market’s “consensus” level. Expect reactions on first touch; useful for pullbacks in trending context.
- Balance
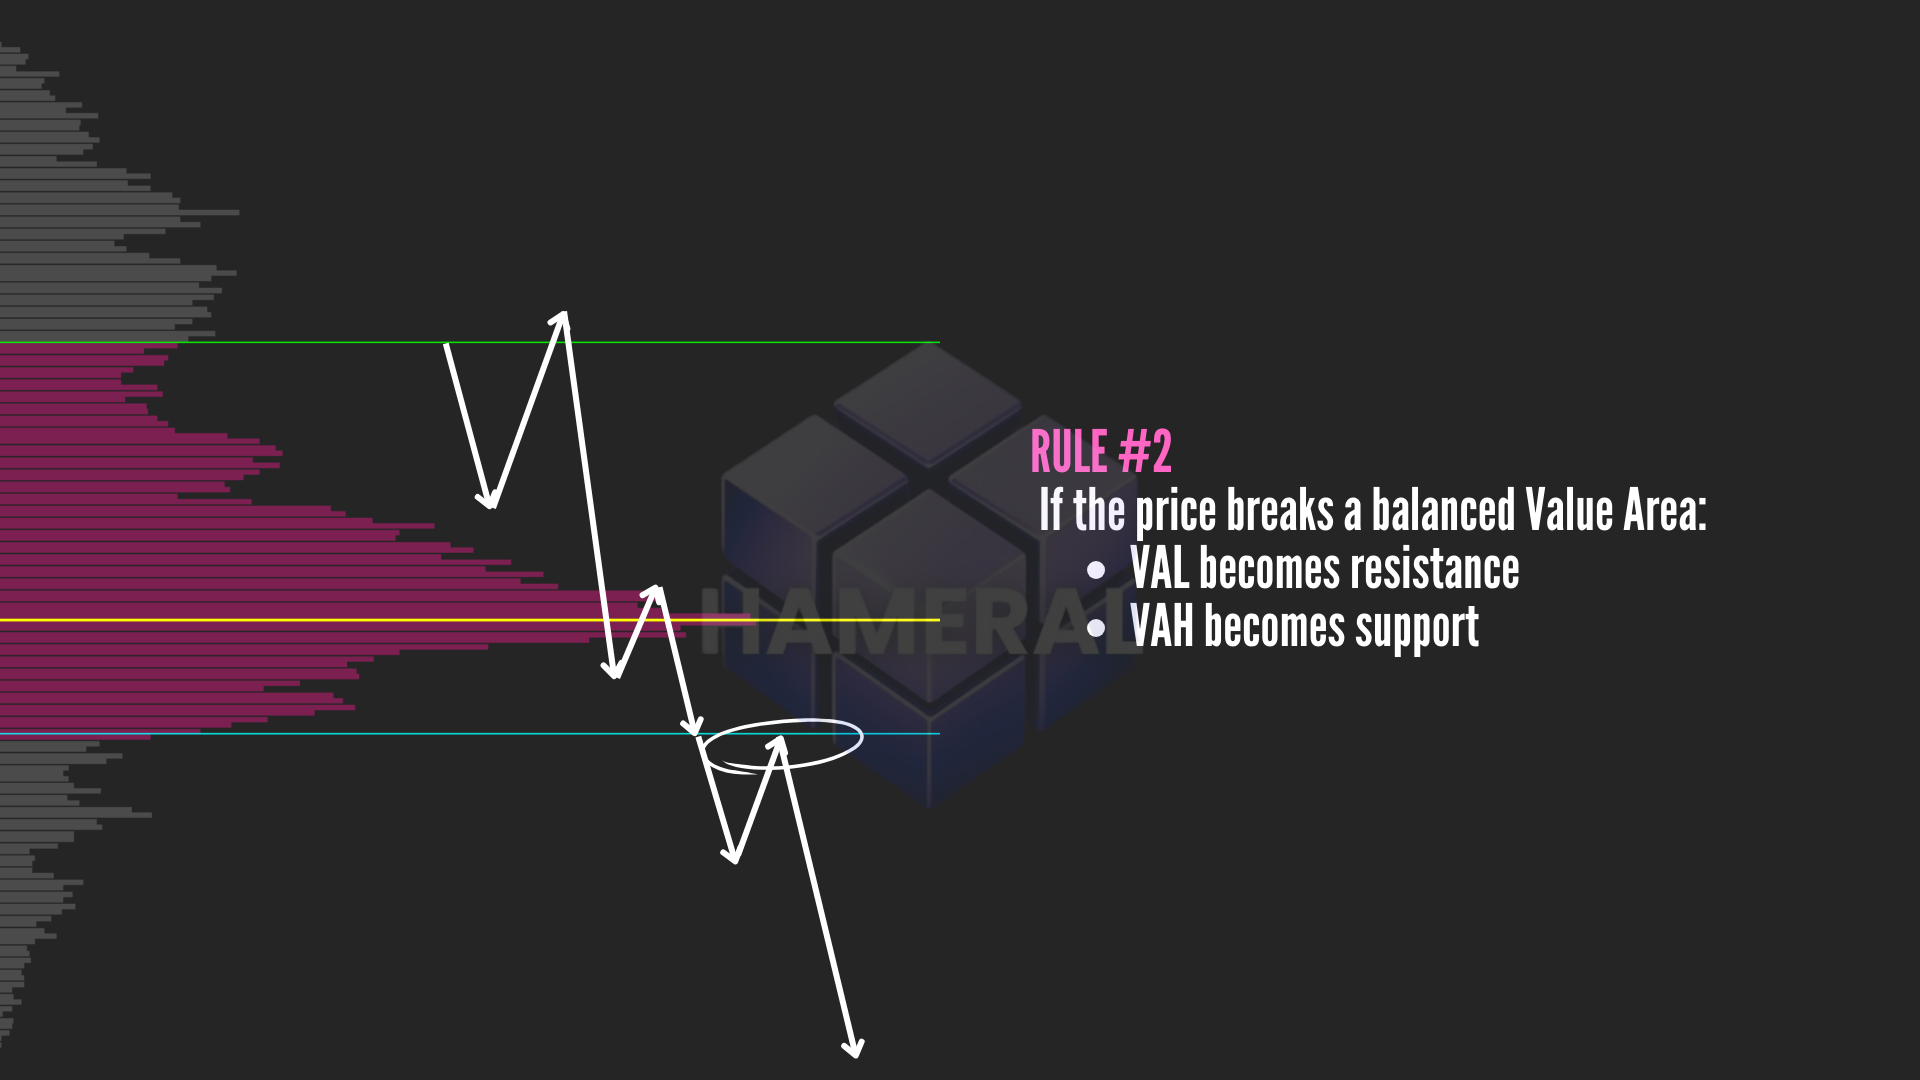
- Price rotates inside the value area – market is accepting that value. Favor rotational trades (fade near VAH/VAL) until acceptance clearly shifts.
- Imbalance
- Price rejects prior value and searches for a new one – think discovery, initiative moves, and breakouts. Favor continuation setups over fades.

Now… how do you identify whether the market is more likely to be ranging or trending before the New York open?
Start simple: use an RTH chart with Volume Profile and look at where we’re opening relative to yesterday’s value.
Use the open as a starting hypothesis, not a certainty. Let acceptance (time + volume) confirm or deny the idea.
✅ 3 Volume Profile rules that can indicate the context of the day:
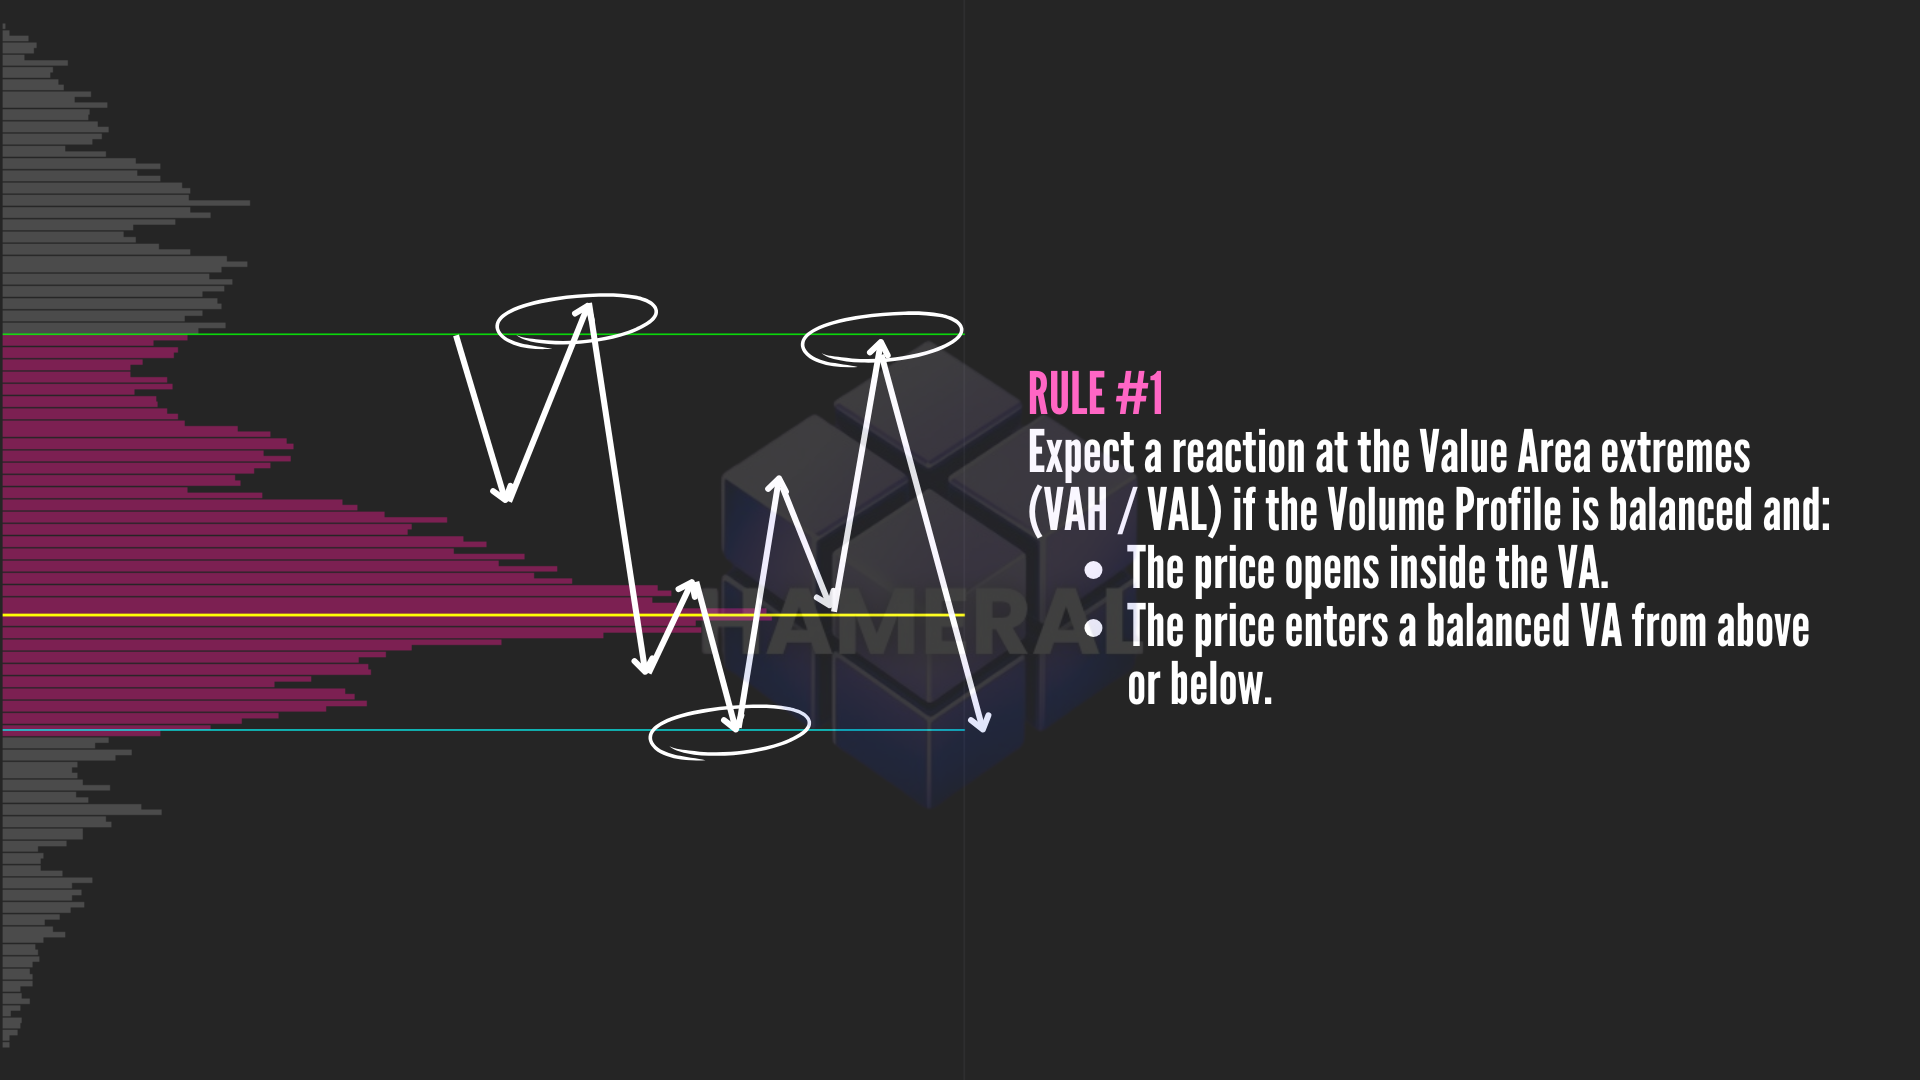
1️⃣ Open inside Value → Suggests a balanced day
Points to a potential ranging environment. A common approach is to sell near VAH and buy near VAL—until one side wins acceptance outside.
2️⃣ Open below VAL → Suggests bearish imbalance
Sellers are pressing. Short setups may have better odds, ideally on retests near VAL or clean resistance.
3️⃣ Open above VAH → Suggests bullish imbalance
Buyers are driving. Long setups are often favored on pullbacks toward VAH, the POC, or stacked support zones.
Bottom line: the opening location indicates context; your confirmation comes from acceptance/rejection at the references (and, ideally, order flow tools like Footprint and Delta).


Volume Profile Shapes: Small Clues with Big Impact
Volume Profile shapes can offer also clues about the next move. The distribution of volume, stacked near the top, bottom, or center, show where value was accepted or rejected, which helps set expectations before price moves.
🧱 Value at bottom (b-shape): sellers dominated; bounces can be fragile.
🧱 Value at top (p-shape): buyers aggressive; dips can get scooped.
🧱 Value centered (D-shape): balanced; fade extremes until acceptance breaks.
Bonus tip: If yesterday’s profile looked unusual (very thin or one-way), compare your levels with another recent, more balanced session nearby. It helps avoid anchoring to a distorted picture.
Bottom line: Shapes organize the auction into clear, testable ideas. They don’t guarantee outcomes, but they improve odds, tighten risk, and make decisions repeatable.
How to Read Market Context with Volume Profile
Before the New York open, run this quick routine. It’s simple, repeatable, and keeps decisions grounded in Volume Profile, not guesses.
1️⃣ Pin your map: Mark yesterday’s VAH, POC, and VAL on the RTH chart.
Think of these as your North, South, and Center. Most of the day’s story pivots around them.
2️⃣ Glance at the open: Is price opening above VAH, below VAL, or inside value?
That opening spot is a hint, not a prophecy:
• Above VAH → suggests bullish imbalance
• Below VAL → suggests bearish imbalance
• Inside value → suggests balance/rotation
3️⃣ Pick a working bias: Based on the open, lean imbalance (trend-seeking) or balance (range-prone).
Say it out loud: “Today leans ___ unless acceptance flips.” It keeps the mind honest.
4️⃣ Plan the triggers around the references:
If the bias is up, look for pullbacks toward VAH/POC that hold.
If down, watch for acceptance/failure below VAL and clean retests.
If balanced, traders are watching for fade moves near VAH and VAL until acceptance builds outside.
Tip: Define where the idea is wrong (quickly). Targets often gravitate to POC, HVNs, or the opposite edge of value.
5️⃣ Zoom in at the level (confirmation): Use Footprint, Cumulative Delta, Delta Profile, and VWAP.
You’re looking for absorption (stops a move), exhaustion (side runs out of gas), or an initiative push (aggressive prints through LVNs).
If confirmation isn’t there, no trade is a trade.
Bottom line: Let acceptance (time + volume) confirm or reject the idea. If price can’t hold where it “should,” flip the script fast and protect risk.
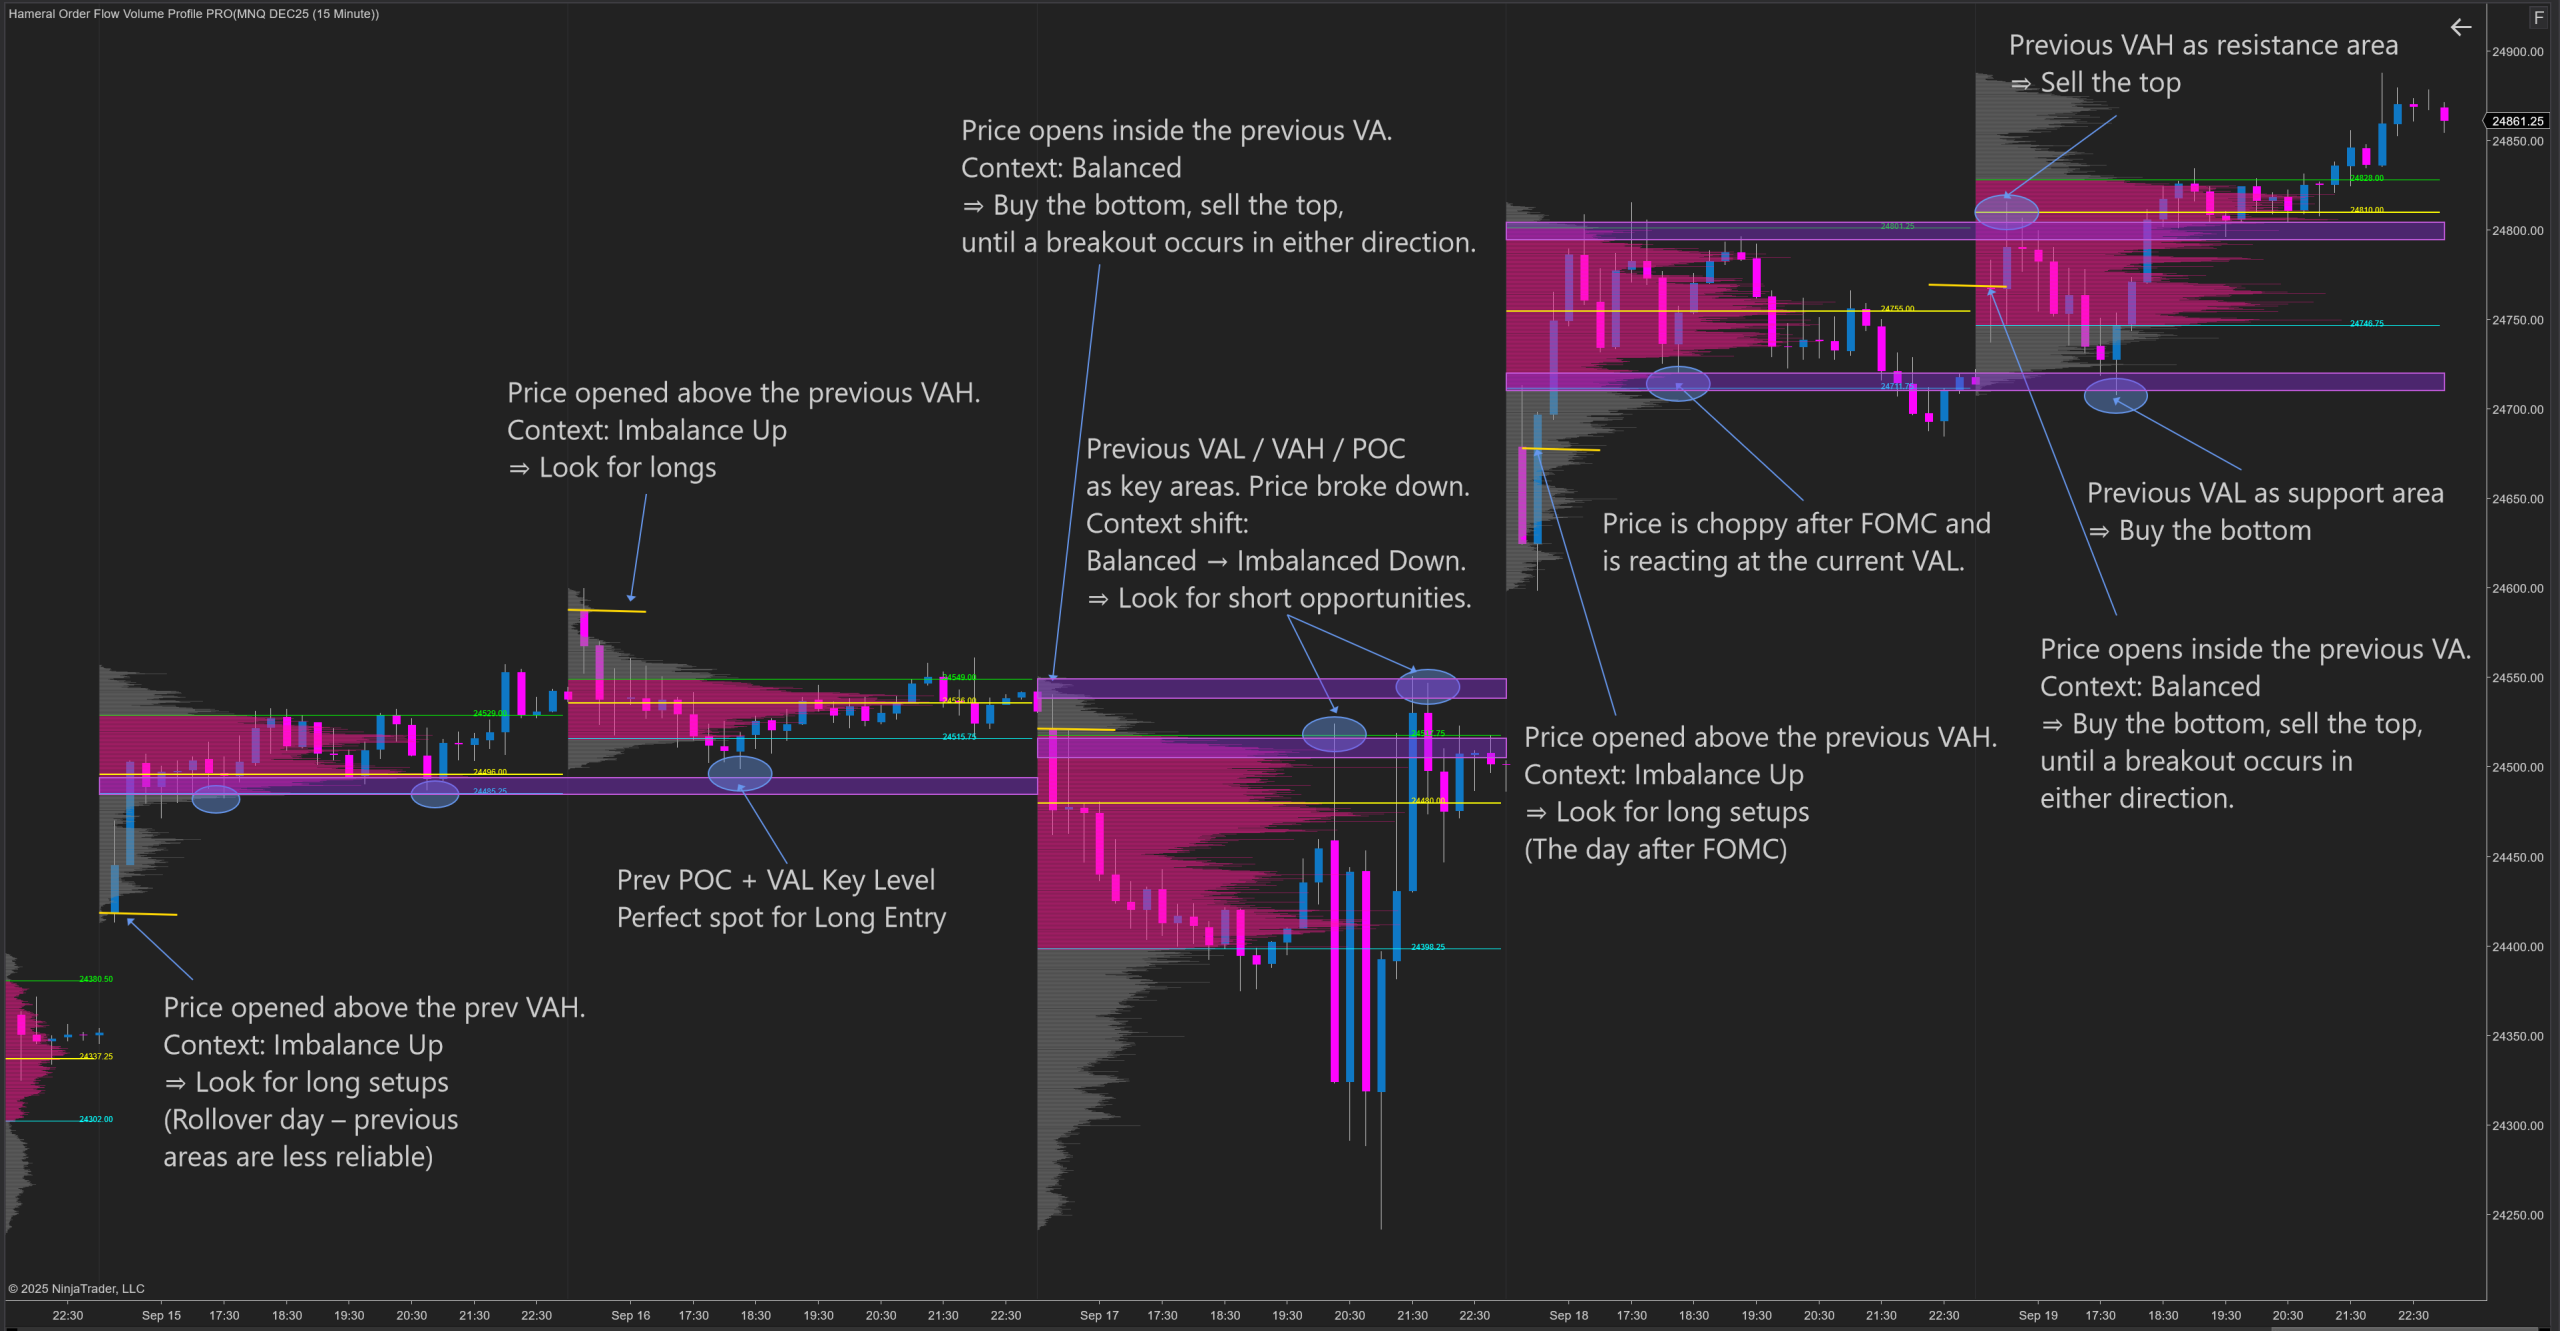
Look at the one-week context; the pattern repeats day after day.

Order Flow Tools For NinjaTrader Traders
If you’re using NinjaTrader 8, the Hameral Order Flow PRO Pack gives you the essential toolkit for order flow analysis – so you can read context, confirm entries, and manage risk without juggling multiple add-ons.
Set up Volume Profile, Footprint, Cumulative Delta, and VWAP on your RTH chart and run the pre-open read. It keeps the context honest and the entries selective.
Here’s what’s inside the toolkit:
- 🧠 Volume Profile – multi-timeframe with advanced features
- 📏 VWAP – multi-timeframe
- 🔥 Footprint – auto-absorption detection, Telegram bot (auto-sends absorption signals), and a complex delta table
- 🔁 Cumulative Delta
- 📉 Delta Profile – view delta at each price level
- 📍 Anchored VWAP – now with standard-deviation bands
- 📍 Anchored Volume Profile
- 🎯 Super Oscillator – combines 7 oscillators to clarify market extension (plots a dot when the market is overextended and a reversal candle forms)

Conclusion: Trade with Context, Not Hope
If guessing is getting old, switch to a clear, repeatable process. Map value with Volume Profile, confirm behavior with Footprint and Delta, and keep bias honest with VWAP and anchored tools.
The Hameral Order Flow PRO Pack brings it all together for NinjaTrader 8—Volume Profile, Footprint, VWAP, Delta tools, Anchored VWAP/Volume Profile, and more—built to support this exact workflow.
Get the Hameral Order Flow PRO Pack →
Disclaimer: This content is educational and not financial advice. Trading involves risk. Always do your own research and consult a licensed professional if needed.

