How to Read the Market with Volume Profile and Order Flow: Step-by-Step Real Trade Breakdown
Let’s be honest…
Most traders see the market — but don’t truly understand what’s happening underneath.
That’s why they hesitate. Or chase. Or get shaken out just before the real move happens.
If that’s where you are right now — you’re in what we call Stare 1: the foggy zone. You see price move, but you don’t really hear what the market is saying.
The goal? Stare 2. The zone of clarity — where you recognize the patterns, read the pressure, and know when to act.
In this guide, you’ll learn exactly how to bridge that gap.
No hype. No guesswork.
Just one real trade example, six order flow tools, and a breakdown that’ll shift how you see the charts — starting now.
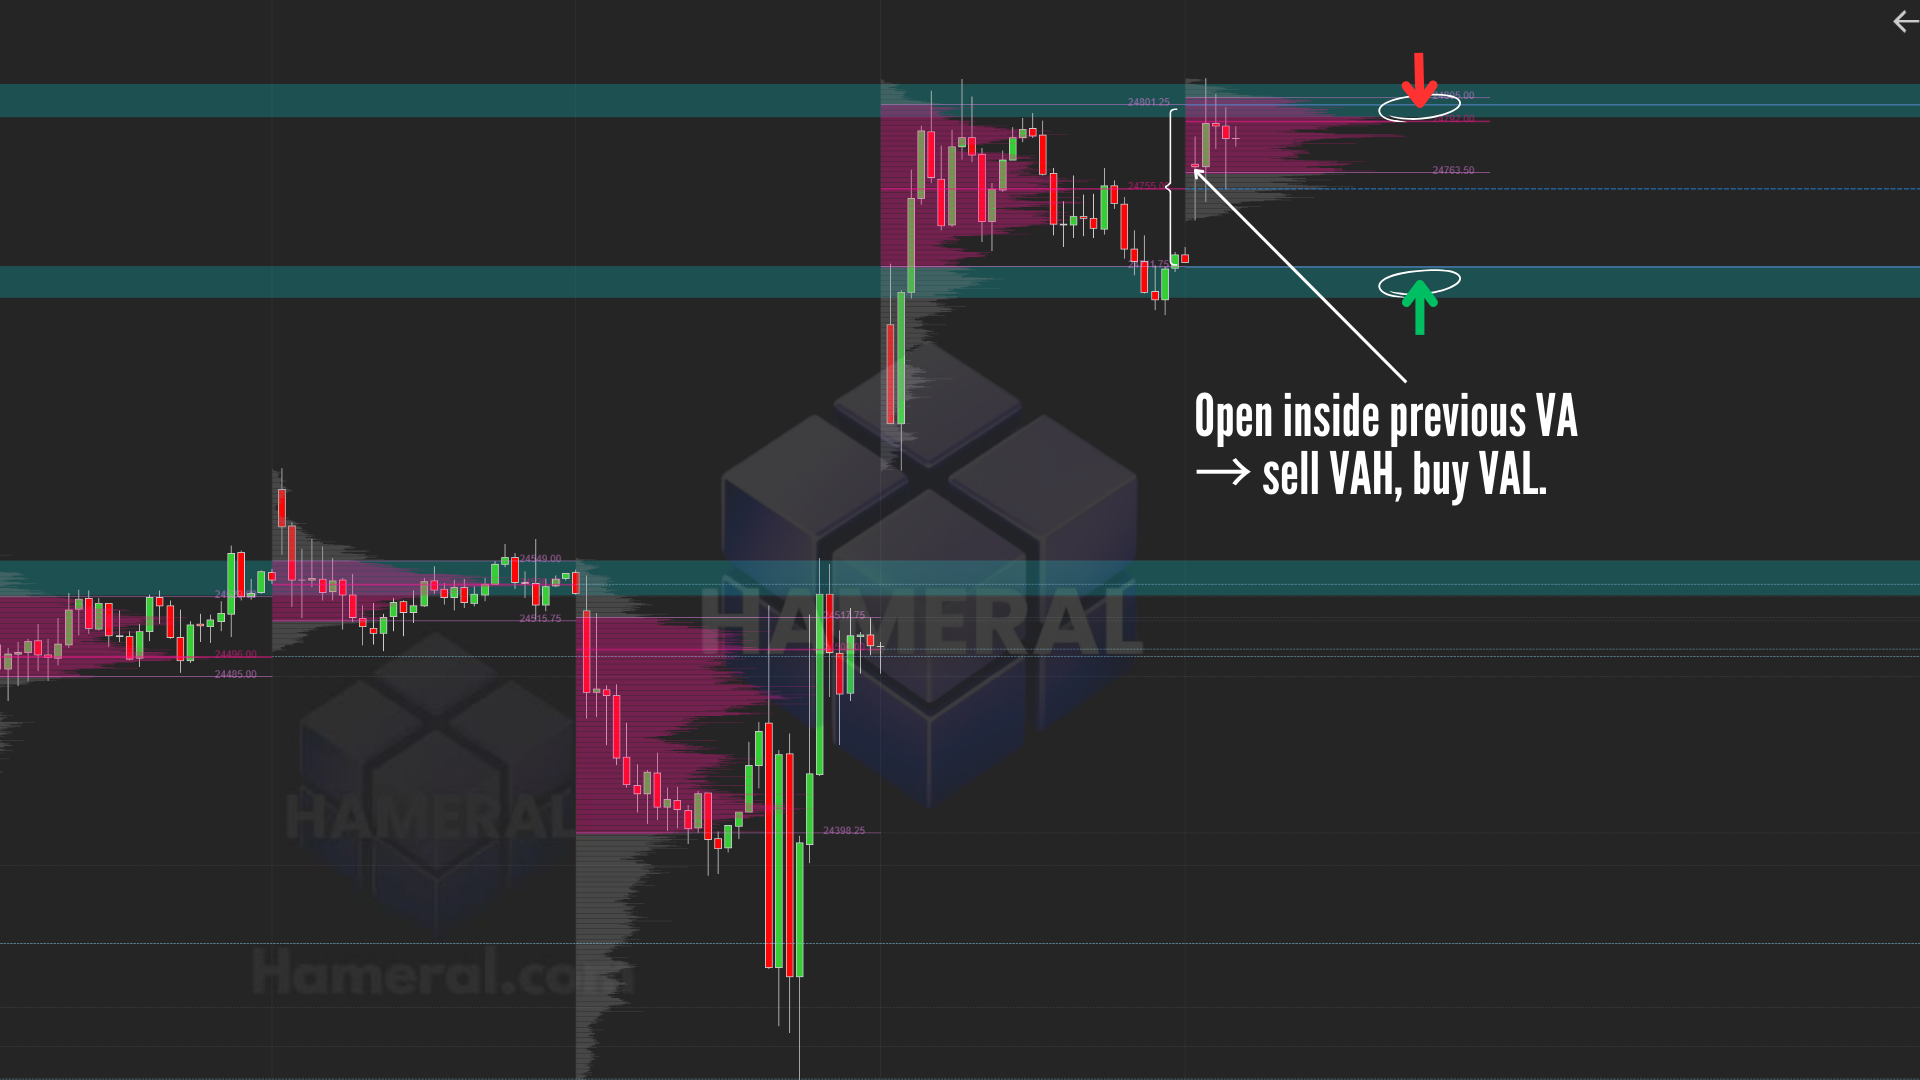
📍 Step 1: Understand Market Context with Volume Profile
Before we talk indicators, let’s zoom out.
Think of the market like a battlefield.
You wouldn’t enter a fight without knowing where the enemy is, how strong they are, or where they’ve been fighting.
That’s what Volume Profile helps us see.
In this trade, price opened inside the previous day’s Value Area. That tells us something critical:
- Balanced market structure
- Range day expected — trade edges, not breakouts
This is where the story begins.

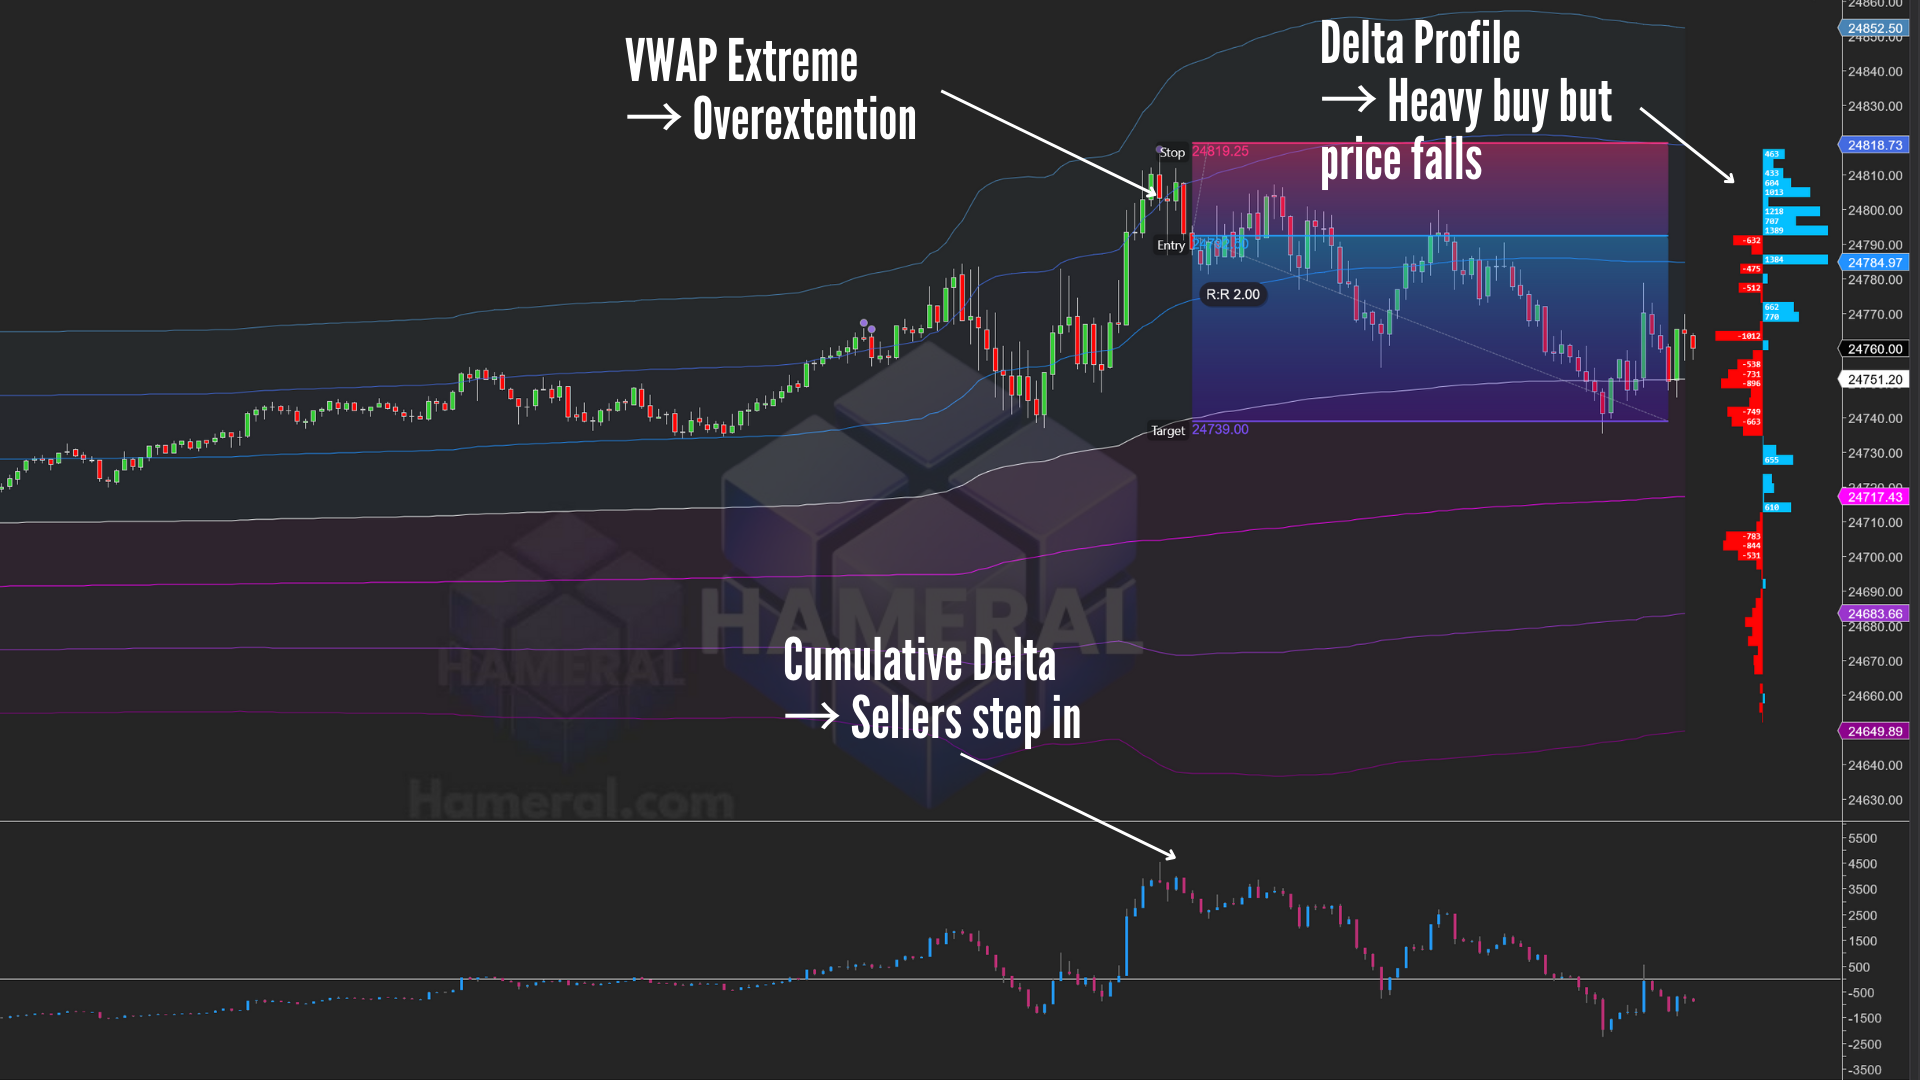
📏 Step 2: Use VWAP to Spot Overextension
VWAP — or Volume Weighted Average Price — acts like a magnet for price.
But we go a layer deeper: +2 and -2 Standard Deviations that shows us when the market is too far for the average price, that means the price is overextended.
In this case, price approached:
- +2 SD on the ETH session VWAP
- +2 SD on the RTH session VWAP
That’s a textbook overextension. The market is stretched. Ideal for a reversal… if pressure shows up.
📊 Step 3: Cumulative Delta Shows the Battle
Cumulative Delta tells us who’s winning the order flow battle — buyers or sellers.
Here, sellers began stepping in… and kept pressing.
Delta turned negative and stayed there. That means:
- Sellers were taking control
- Buyers were fading
Now we’re seeing behavior, not just price.

🧠 Step 4: Delta Profile Reveals Hidden Absorption
Delta Profile shows where aggressive buying or selling happened… and whether it worked.
What we saw:
- Heavy buy orders hitting the ask
- But price couldn’t move higher
That’s absorption. Effort without result = weakness.
Think of it like a boxer throwing punches… but not landing any.
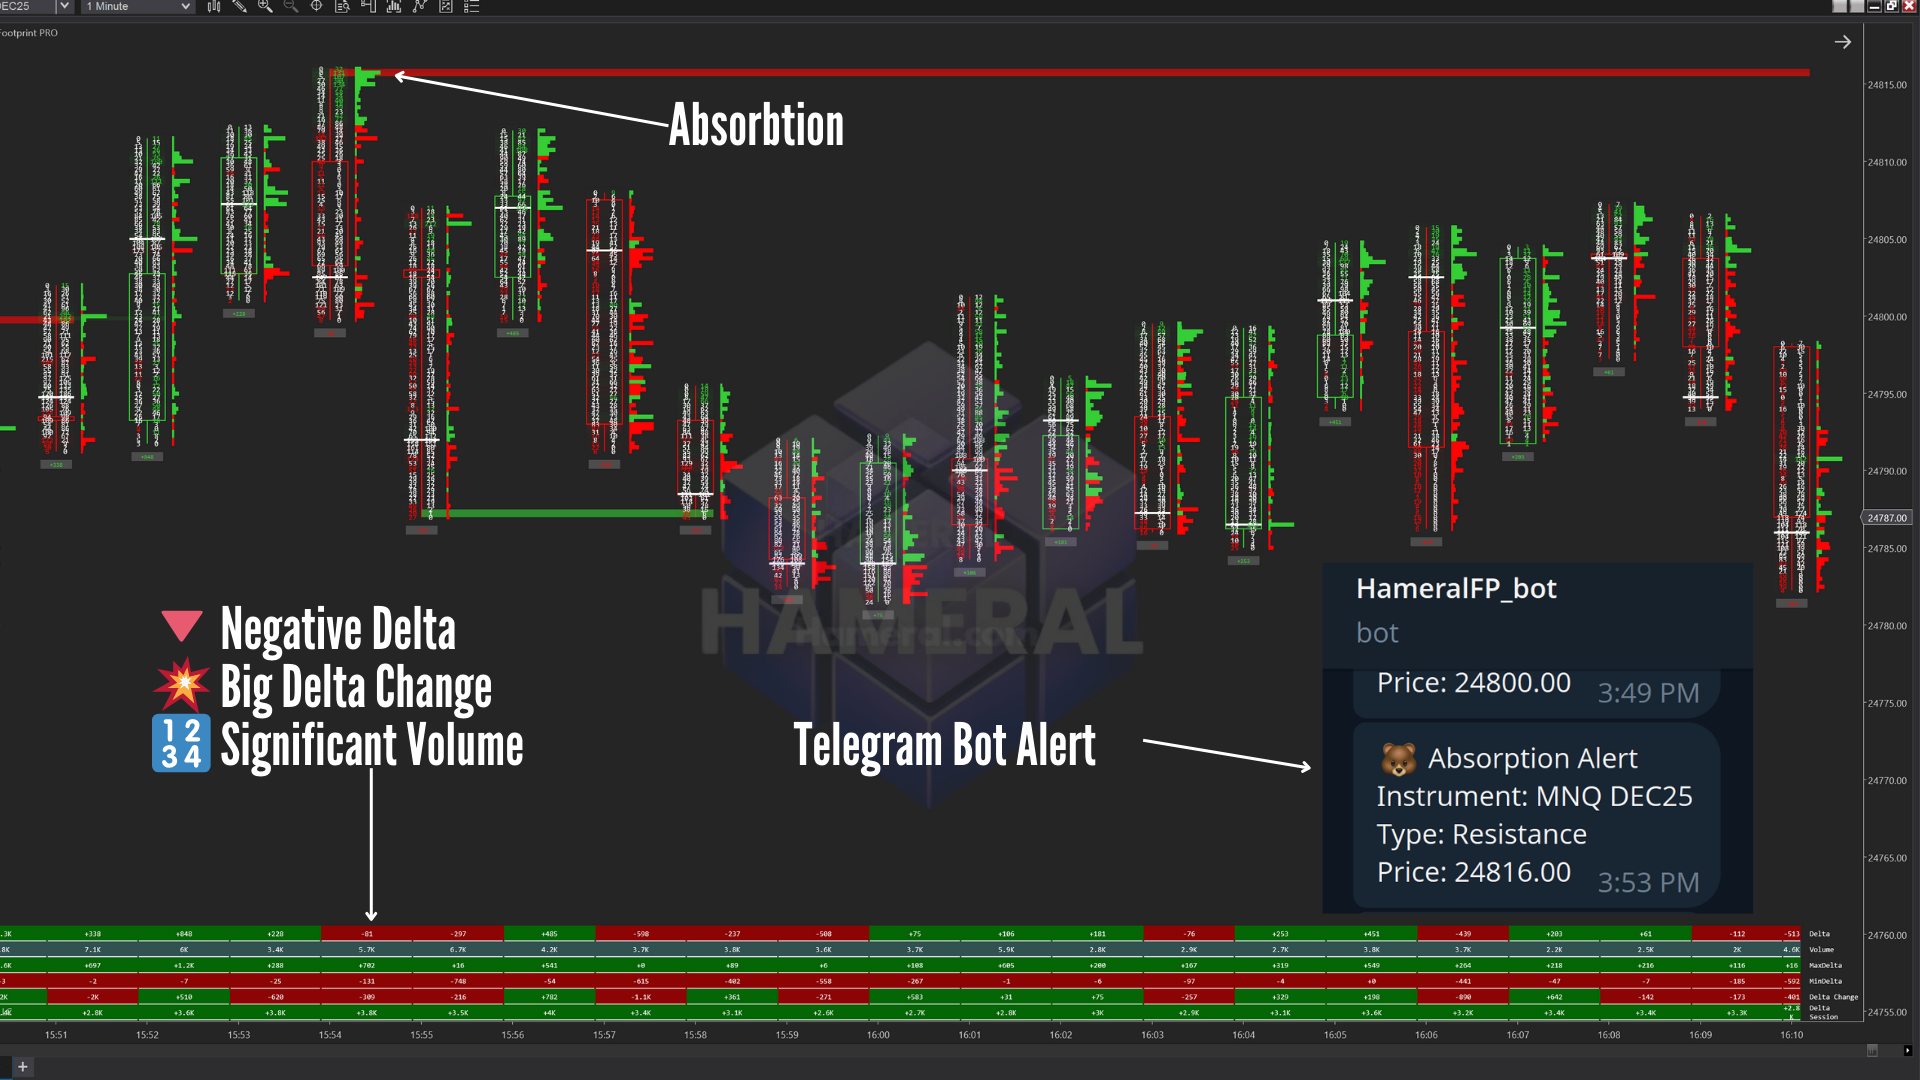
🔎 Step 5: Footprint Chart Confirms the Story
The Footprint Chart shows the market’s X-ray.
At the top of this move, we saw:
- 🔻 Negative Delta
- 💥 Large Delta Shift
- 🔢 High Volume
The market was shouting: “Buyers are exhausted.”
Even better? Our Hameral bot fired a Telegram alert — confirming this absorption setup in real-time.

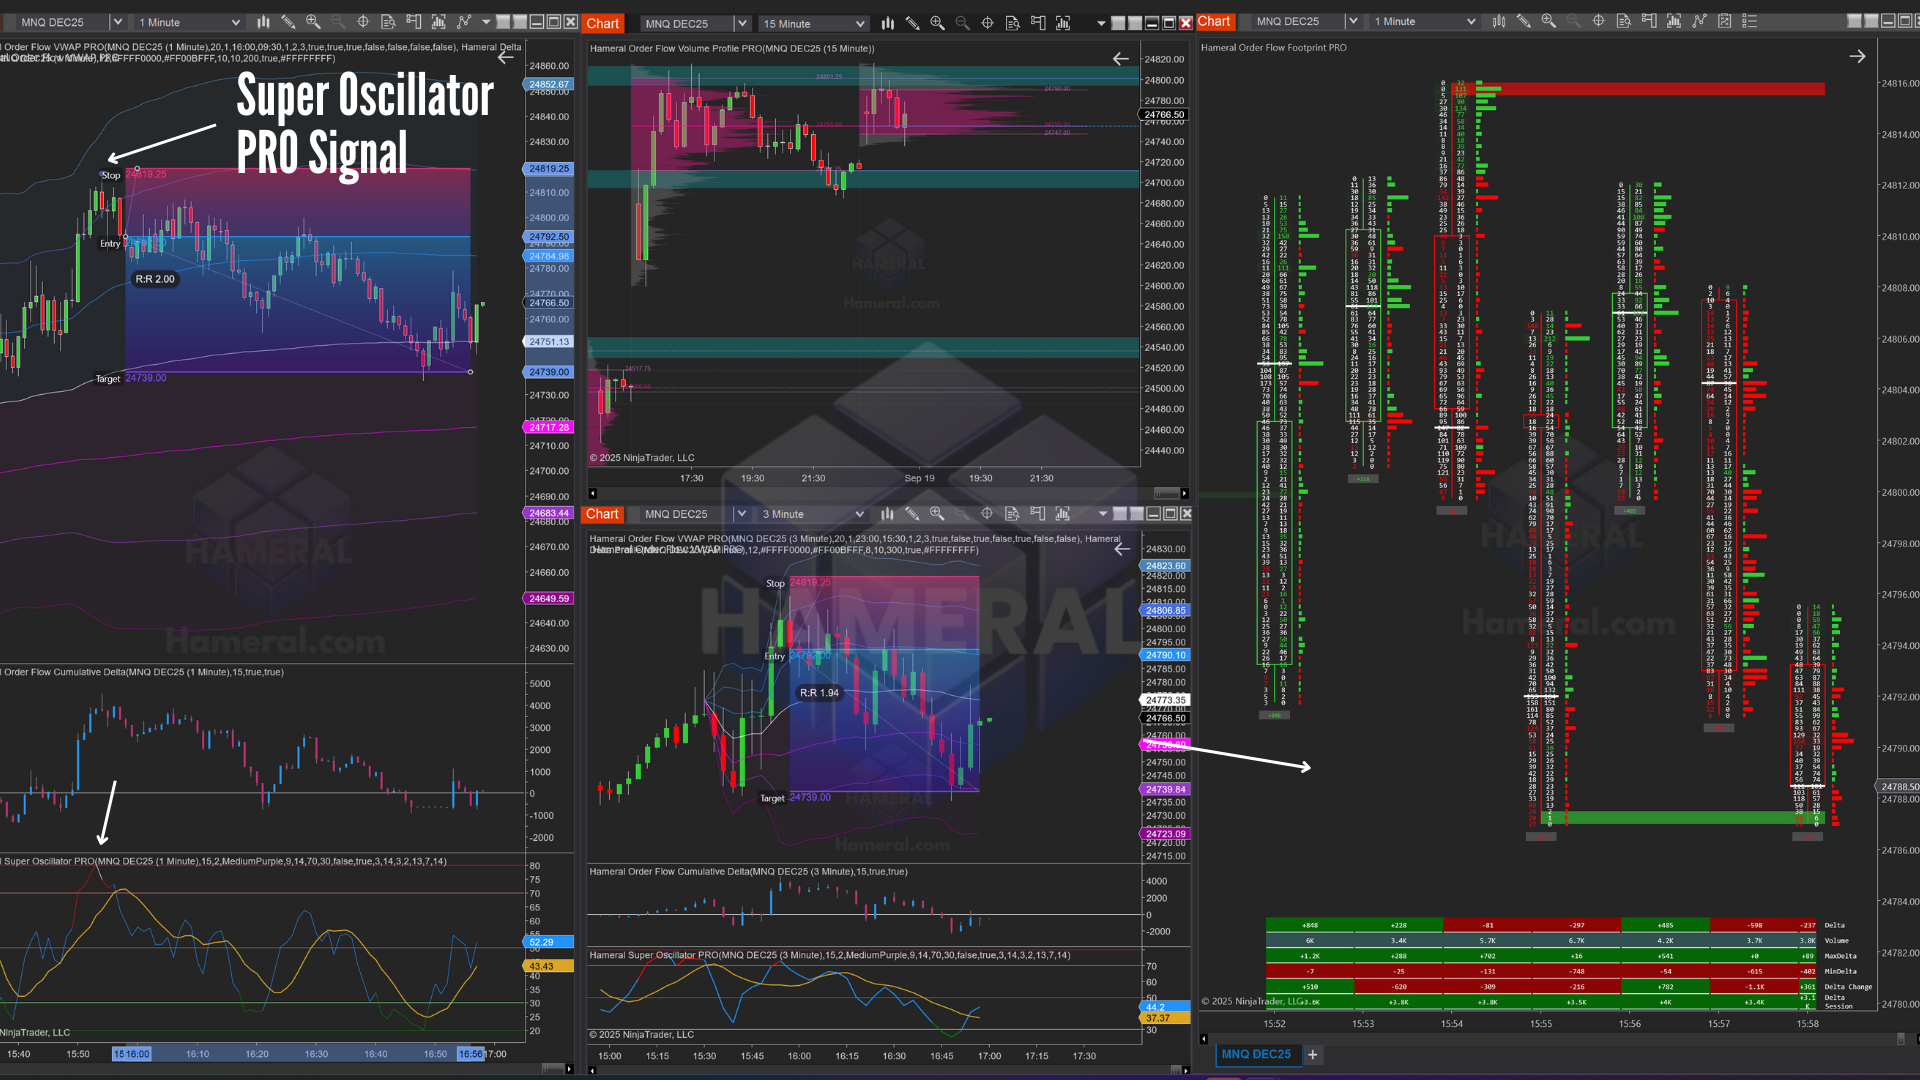
🌀 Step 6: Super Oscillator Times the Move
The Super Oscillator gave us the final green light:
- 🟣 Purple dot = exhaustion candle
- ⚠️ Clear divergence
- ⏱️ Sharp exit = move likely finished
Six tools, one story. When everything aligns like this — that’s when you act.

🎥 Watch the Trade Breakdown
Want to see this trade step-by-step?
👉 Watch the full video here — and learn how these tools worked together inside NinjaTrader with Hameral indicators.
💡 Why This Strategy Works
This is not about “signals.”
It’s about seeing the market clearly — from six angles that support each other:
- Context: Volume Profile shows what type of day it is
- Overextension: VWAP tells when price is stretched
- Pressure: Cumulative Delta shows who’s winning
- Effort: Delta Profile tracks strength vs. result
- Confirmation: Footprint Chart prints it clearly
- Timing: Super Oscillator helps time your entry
No more chasing. No more guessing. Just clean logic.
🧭 What’s Next?
This was a trending day example.
In the next article, you’ll learn how to use Super Oscillator + Footprint absorption to trade ranges cleanly.
🚀 Ready to Stop Guessing?
You have two options:
- ❌ Keep guessing with lagging indicators…
- ✅ Or learn how to read real market behavior — with help
👉 Explore Hameral’s Order Flow Tools
This is your path to clarity.
Disclaimer: The information provided in this article is for educational purposes only and does not constitute financial advice, investment advice, or trading recommendations. Trading futures and other financial instruments involves significant risk and may not be suitable for all investors. Past performance is not indicative of future results. Always do your own research and consult with a licensed financial advisor before making trading decisions. Hameral is not responsible for any losses incurred as a result of using the information presented here.

