The Ultimate Guide to Order Flow Trading (2025 Edition): Tools, Strategies & Real Examples
Introduction
In the high-speed environment of futures trading, timing and insight can make the difference between opportunity and uncertainty.
Many traders still rely on lagging indicators, generalized chart patterns, or traditional price action alone – often missing the underlying intent of the market.
Order flow trading changes that.
This guide explains how traders use real-time order flow data through tools like Volume Profile, VWAP, Cumulative Delta, and Footprint Charts – to understand market behavior at a deeper level.
The goal is not prediction, but interpretation: reading supply, demand, and participation as they unfold.
This is not a shortcut to success. It’s a framework used by professional traders to make decisions based on observable market activity rather than speculation.
What Is Order Flow Trading?
Order flow trading is the analysis of actual buying and selling activity in the market, often visualized through volume-based tools and bid/ask interactions.
Unlike traditional technical indicators that rely on historical price calculations, order flow tools provide insights into:
- Which side – buyers or sellers – is exerting more pressure
- How volume is distributed at each price level
- Whether large trades are being absorbed or driving momentum
This approach helps traders identify:
- Potential breakout or reversal zones
- Institutional price defense around key volume levels
- Shifts in sentiment, confirmed by cumulative order flow patterns
Rather than relying solely on price patterns, order flow trading offers a transparent view of the underlying activity behind each move.
Why Use Order Flow Trading?
Traditional tools provide a summary of what has happened. Order flow tools show what is happening right now.
Here’s how traders benefit:
- Volume Profile reveals value areas, high-volume nodes (HVNs), and low-volume rejection zones.
- VWAP acts as a dynamic average price – a reference point used by institutions to manage execution.
- Cumulative Delta tracks net aggressive buying or selling, often signaling exhaustion or divergence before price reverses.
- Footprint Charts show granular buy/sell imbalances at each price level – ideal for precision entries and context.
These tools do not predict outcomes. They provide a lens into the current auction of the market – helping traders make better-informed decisions.

Core Tools of Order Flow Trading
Volume Profile
Displays the distribution of traded volume at each price level. Key concepts:
- HVNs: Support/resistance zones
- LVNs: Breakout/reversal levels
- Value Area: 70% of volume traded
Key areas intese used by traders:
- Value Area High – VAH – the top part ot Value area
- Value Area Low – VAL – the bottom part of Value area
- Point of Control – POC – the level with the most volume of trade
VWAP
Volume Weighted Average Price is a benchmark used by institutions. Deviations from VWAP can indicate overbought/oversold zones.
Cumulative Delta
Sums aggressive buys vs. sells. Divergences often precede reversals or confirm strength.
Footprint Charts
Show executed volume at bid and ask. Highlight imbalances, absorption, and trading activity at precise levels.
Note: While some traders use DOM (Depth of Market), this guide focuses on chart-based tools available in Hameral’s ecosystem.
Order Flow Trading Strategies
Delta Divergence Reversals
- When price makes a new swing high or low but Cumulative Delta does not confirm the move, it may indicate exhaustion and a possible reversal.
- When price changes direction but Cumulative Delta doesn’t follow, this may signal a hidden divergence or underlying weakness in the move.

Volume Profile Rejection Zones
- When price enters a low volume node (LVN) and rejects, traders look for confirmation to trade away from that area.
- If price trades within the value area (between VAL and VAH) and touches one of these levels for the first time, traders anticipate a potential rejection for trade entry.
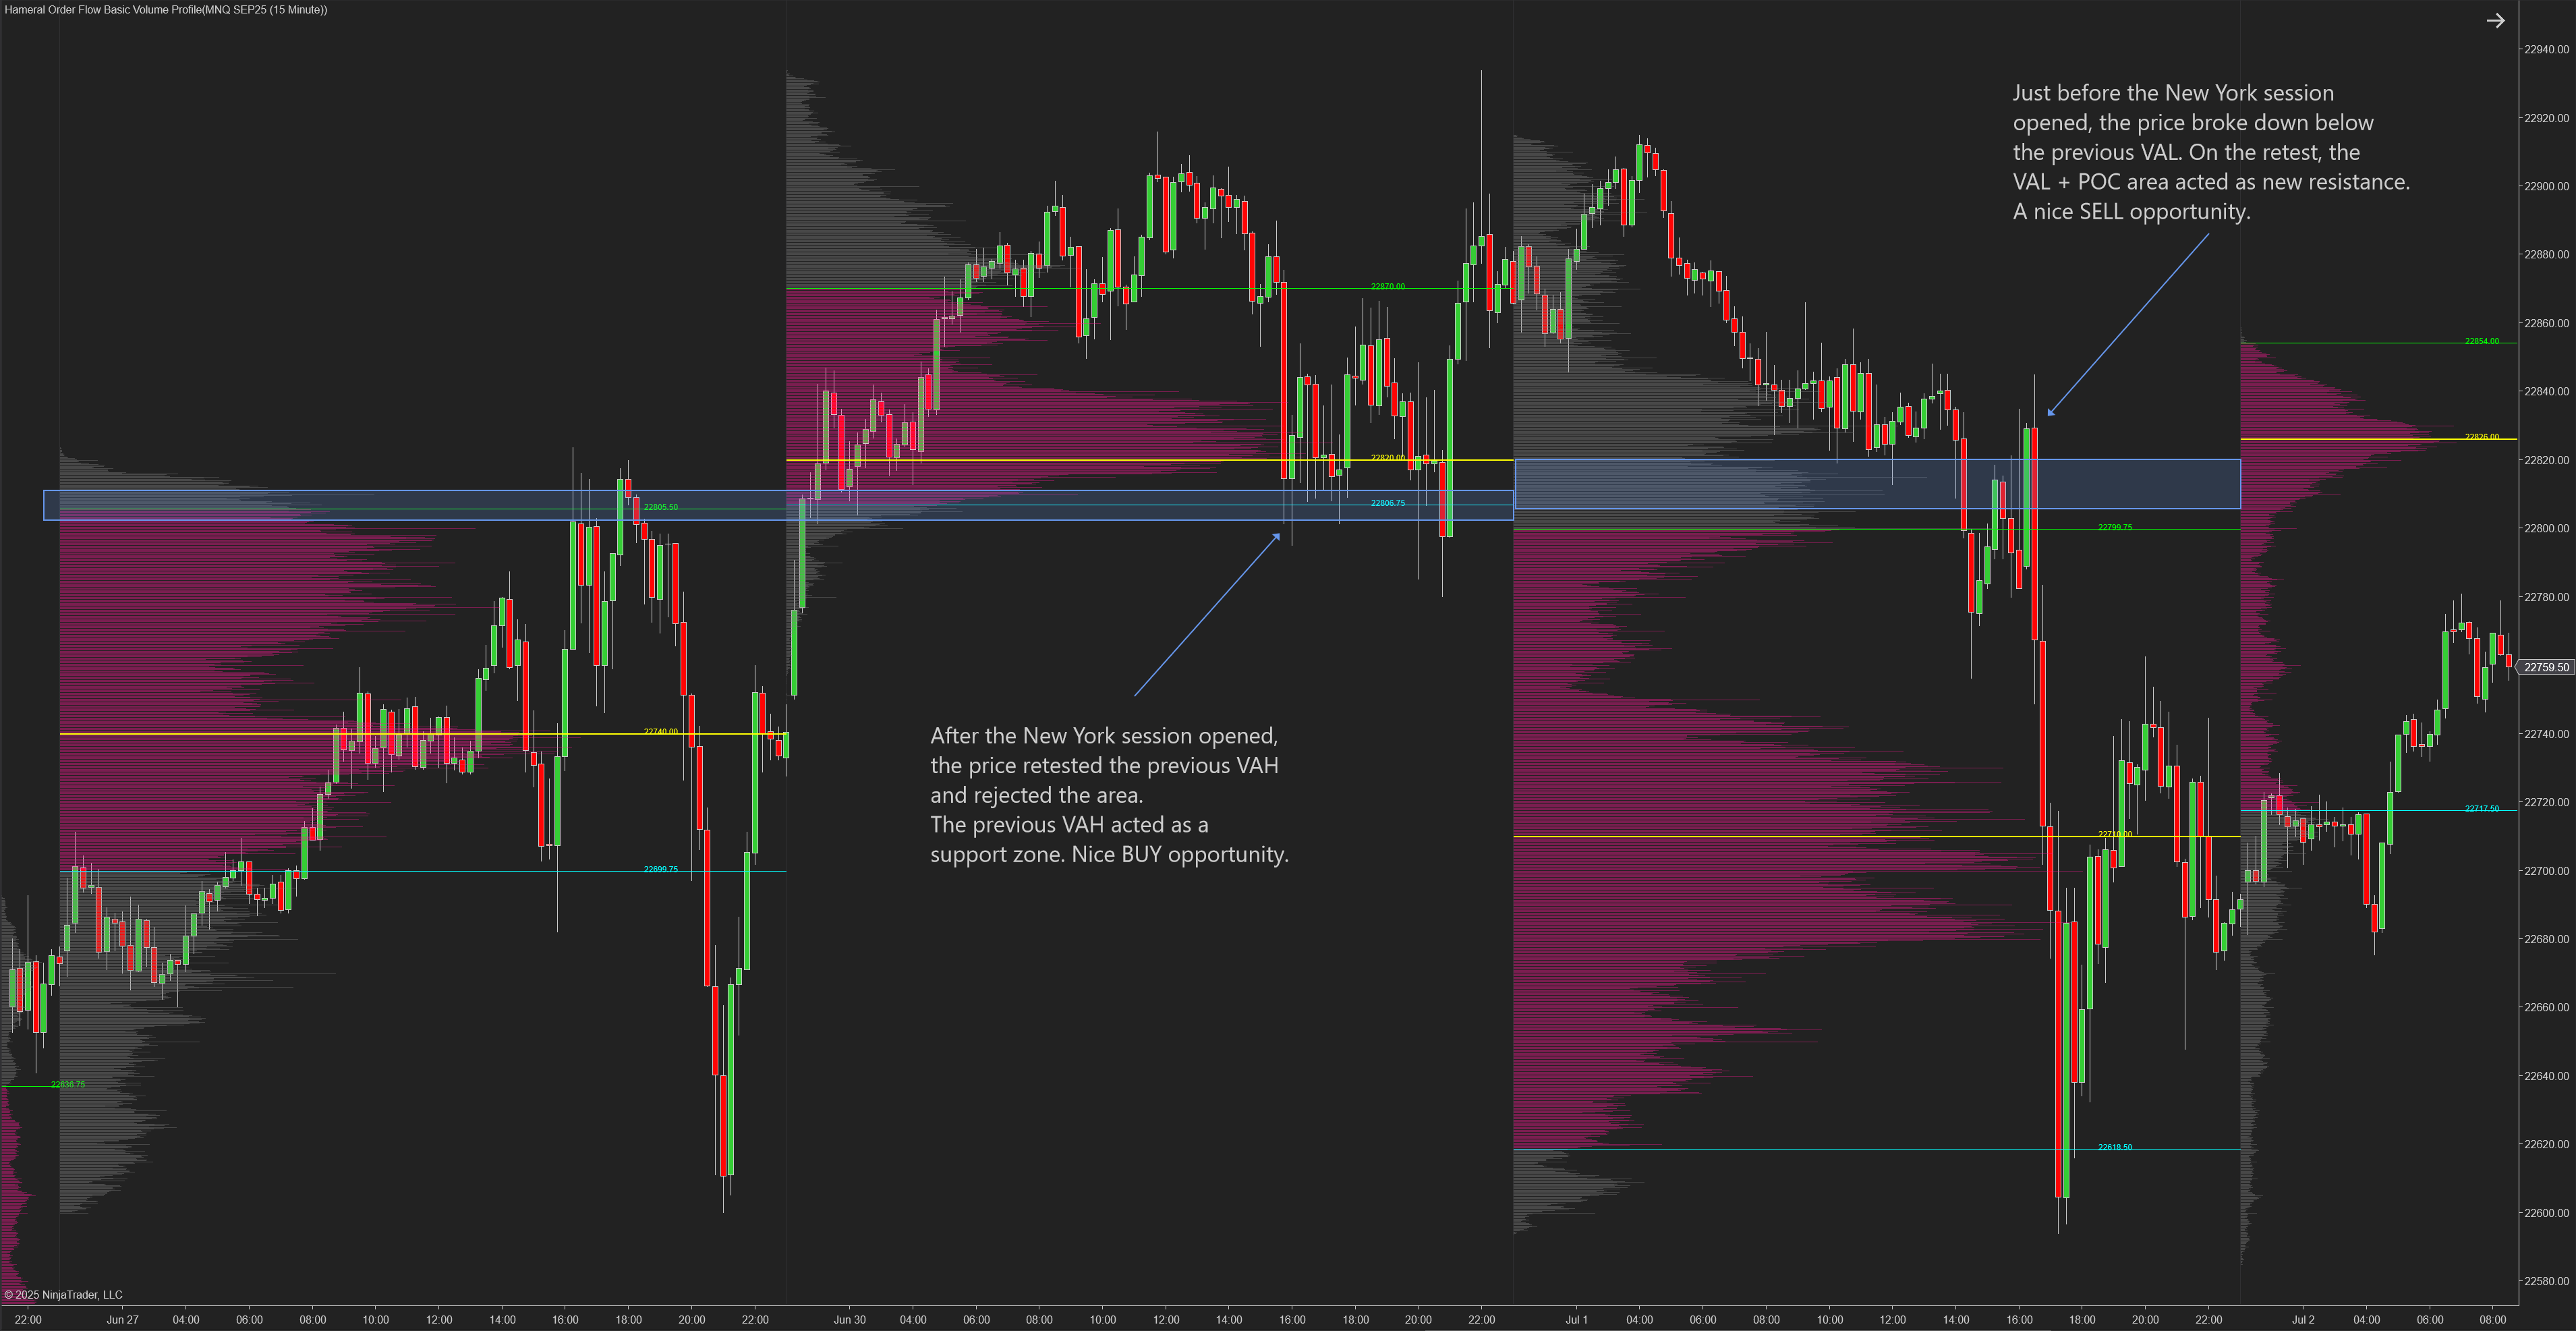
- When price was previously above VAH and retests that area, traders look for rejection to enter a short trade.
- When price was previously below VAL and retests that area, traders watch for rejection to consider long opportunities.
- When price moves quickly into the Point of Control (POC) and then rejects, it can serve as a valid setup for a reversal or breakout continuation.
VWAP & Standard Deviation Bands Pullback Entries
- Pullbacks to VWAP often present continuation setups when supported by delta confirmation or footprint imbalance.
- When price touches the ±2 or ±3 standard deviation bands, the move is considered overextended. Traders watch for rejection signals at these zones.
- Holding above +1 standard deviation can suggest a bullish context; traders may favor long trades.
- Holding below -1 standard deviation can suggest a bearish context; traders may favor short trades.

Footprint-Based Setups
Breakout Confirmation
Breakouts tend to have higher follow-through when they show:
- Strong ask-side volume
- Clear volume imbalances
- Cumulative delta alignment
Rejection at Key Levels
At key price levels, footprint charts may reveal:
- Absorption
- Trapped orders
- Price closing above/below the POC in the opposite direction of the main trend
- Negative delta for short and positive delta for long
- Sudden delta shift
- Zero prints at key bid/ask levels (e.g., 0 offers at highs for short or 0 bids at lows for long)
When these patterns are observed, traders often monitor for potential reversal setups.

Putting It All Together: A Step-by-Step Approach
Step 1: Volume Profile Key Levels
Watch the Previous Volume Profile key levels (VAL, VAH, POC) and wait for price to touch those areas.
Step 2: Correlate VWAP Levels
Correlate Volume Profile with VWAP levels. Is there alignment or confluence?
For example: the price is touching VAH of the previous day and +2 standard deviation band => price at resitence + overextended, waiting for a short if the next steps are showing agressive selling
If yes, proceed to Cumulative Delta. If no, wait for alignment before taking action.
Step 3: Analyze Cumulative Delta
- Look for divergence between price and delta – is price going higher but delta not following? This may indicate absorption or weakening momentum.
- Is the Cumulative Delta bar bullish if you’re considering a long position, or bearish if you’re considering a short?
- If signals align, move to Footprint for deeper context.
Step 4: Fooprint Confirmation
On the Footprint Chart, look for the following ideal conditions; the more that align, the stronger the trade becomes:
- Absorption of sellers at support zones for long entries, or buyers at resistance for short entries.
- Presence of trapped sellers at the lows (long setup) or trapped buyers at the highs (short setup).
- 0 ask at the bottom of the candle for long, or 0 bid at the top of the candle for short.
- Does the candle close above the POC for long, or below the POC for short?
- Is the delta for that candle strongly positive for long, or negative for short?
- Large buy orders for long / large sell orders for short
- Check for significant delta change – a sharp shift in momentum often precedes reversals or breakouts.
Step 5 (Bonus): 5 min candle confirmation
Is the 5-minute candle showing a strong close and bullish (or bearish) formation that supports your bias?
If multiple conditions align, it may confirm a high-probability trade setup.
Keep in mind: very rarely will all conditions align perfectly. Professional traders understand each layer and test various combinations for consistency. This is how they identify and refine their edge.
Trading is not about blindly executing a fixed system. It’s about understanding the logic of a strategy and putting in the work to align it with your own decision-making process, emotional tolerance, and execution style.
All strategies described are for educational purposes only and should not be interpreted as trading signals or financial advice.
Common Mistakes in Order Flow Trading
- Overreacting to a single signal without context
- Ignoring higher timeframe levels or market structure
- Not combining tools (e.g. delta without volume profile)
- Overfitting setups without journaling and testing
Best Practices for Traders Learning Order Flow
- Focus on one strategy at a time
- Record and journal every trade with screenshots of all indicators
- Study trap setups and absorption zones for confidence entries
- Respect volatility — stay out during news unless experienced
Recommended Tools & Platforms
Hameral offers a complete suite of order flow trading tools and structured education designed for both beginner and advanced futures traders.
✅ For Beginners – Hameral Order Flow Free Basic Pack:
- Volume Profile (single timeframe)
- VWAP with standard deviation bands (just ETH)
- Delta Bars
- Simple Footprint Chart to see the orders inside each candle
Perfect for traders starting to explore order flow.
🔥 For Advanced Traders – Hameral PRO Pack:
- Multi-timeframe Volume Profile and VWAP
- Advanced Footprint Charts with absorption & imbalance detection
- Delta Table: track bar-by-bar shifts, delta strength, and net delta
- Cumulative Delta to catch the real orders move and to understand who is leading the market.
- Full access to Hameral’s advanced education vault
All tools are compatible with leading platforms like NinjaTrader® used by professional traders worldwide.
Hameral is officialy part of NinjaTrader Ecosystem.
NinjaTrader® is a registered trademark of NinjaTrader Group, LLC. No NinjaTrader company has any affiliation with Hameral or endorses its products or services.
FAQ: Order Flow Trading for Futures
Q1: What is Order Flow Trading in simple terms?
A real-time view of buyers vs. sellers based on actual trades, not just price bars.
Q2: Is Order Flow better than technical indicators?
It’s more actionable in real-time. Many professionals combine both.
Q3: Can beginners use these tools?
Yes – and many are surprised to learn how accessible order flow has become. While some traders avoid learning it because they think it’s expensive or overly advanced, that’s no longer the case.
Hameral offers a completely FREE version of its order flow indicators, including essential tools like Volume Profile, VWAP, and Delta – all fully compatible with the NinjaTrader® platform, which is also free to use.
This means any trader – even absolute beginners – can start using professional order flow tools without spending a cent.
Q4: Can this be automated?
Parts of the logic can be semi-automated, but human judgment around absorption, imbalance, and context remains key.
Conclusion
Order flow trading gives futures traders an edge by revealing what’s happening behind the price.
By combining tools like Volume Profile, VWAP, Delta, and Footprint, traders move from reactive to decisive – using real market activity to guide every entry.
If you’re ready to take your execution beyond indicators and into what truly drives markets, Hameral provides the tools, training, and structure to help you build your edge.

Your Complete Order Flow Arsenal for
NinjaTrader® 8
Stop trading blind. With Order Flow Indicators you can see real orders and volumes, understand market dynamics, and make decisions with confidence.
FREE Order Flow Pack For NinjaTrader®
PRO Order Flow Pack For NinjaTrader®
Essential Order Flow Tools

€0
Forever
![]() Daily Volume Profile
Daily Volume Profile![]() Daily VWAP with Standard Deviations
Daily VWAP with Standard Deviations![]() Footprint
Footprint![]() Delta
Delta
Bonus:
![]() Super Oscillator
Super Oscillator![]() Template with the Indicators
Template with the Indicators
Advanced Order Flow Tools

€499
One-time
![]() Complex Volume Profile: Custom Sessions, Multi TF
Complex Volume Profile: Custom Sessions, Multi TF![]() Anchored VP
Anchored VP![]() Complex VWAP with Standard Deviations: Custom Sessions, Multi TF
Complex VWAP with Standard Deviations: Custom Sessions, Multi TF![]() Anchored VWAP
Anchored VWAP![]() Multiple Footprints: volumes, imbalance zones, POC etc.
Multiple Footprints: volumes, imbalance zones, POC etc.![]() Cumulative Delta
Cumulative Delta![]() Delta Profile
Delta Profile
Bonus:
![]() Super Oscillator PRO
Super Oscillator PRO