Hameral Order Flow Footprint
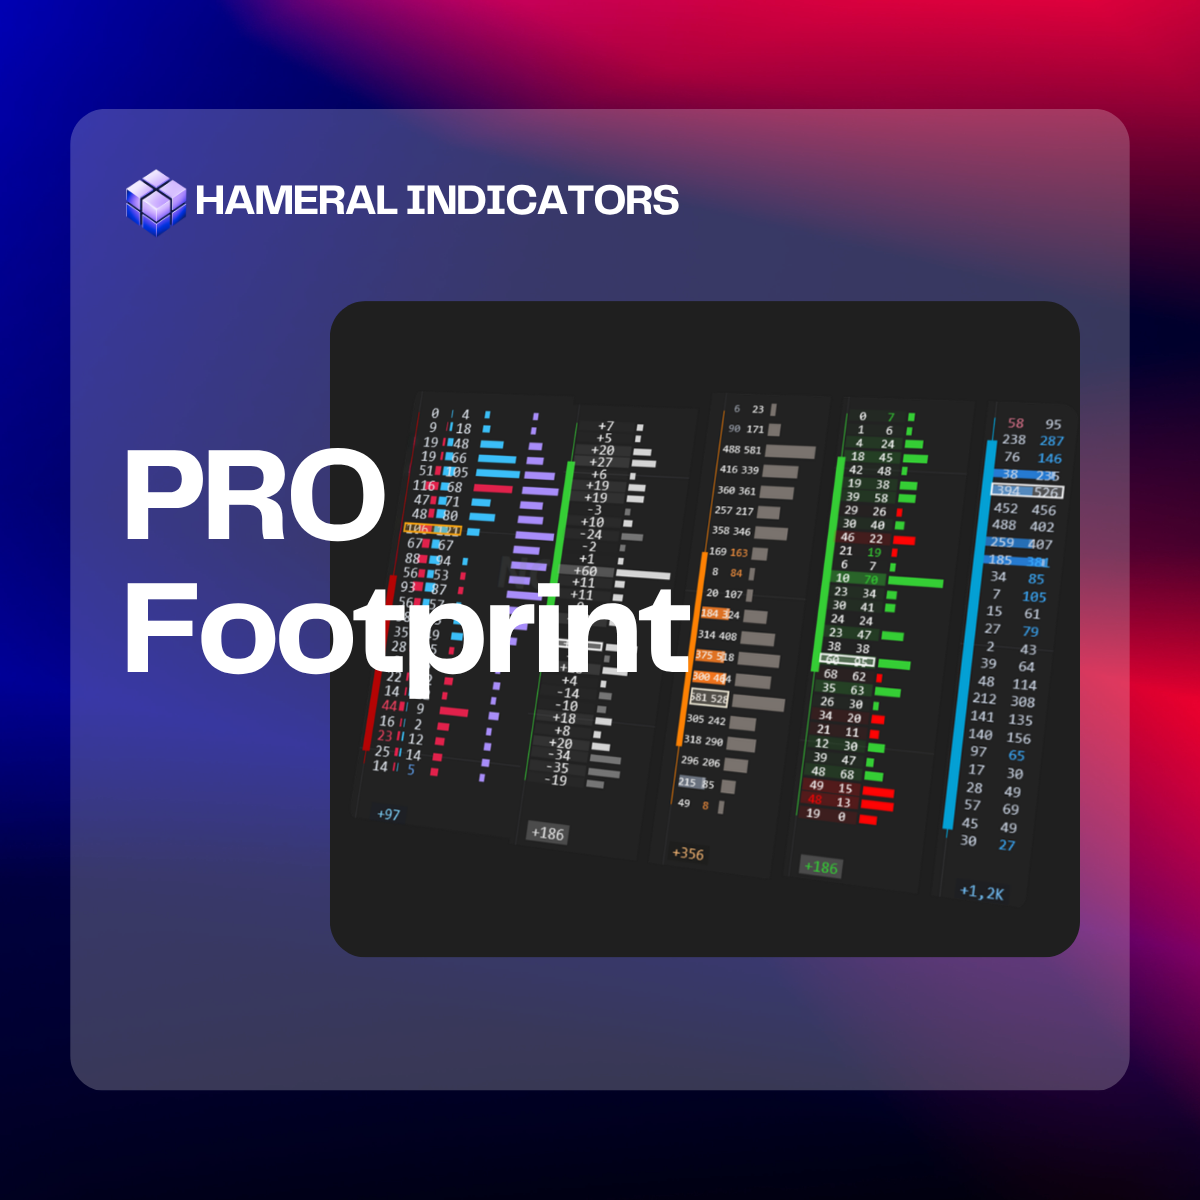
See buy/sell volume inside each candle, and spot POC, delta, imbalances and absorbtions fast. Includes a complex live data delta table.

✔️LifeTime License ✔️ Free Updates ✖️ No Order Flow+ Needed
🛡️Secured SLL Checkout
💳 All Major Cards
✖️ VAT Not Included
Description
Footprint PRO for NinjaTrader 8 lets you see real market control — with bid/ask volume, imbalances, and absorptions shown clearly on the chart.
It highlights key zones, colors buy/sell pressure, and sends Telegram alerts when major activity hits.
You get a delta heatmap, complex delta table, and delta profile to spot where big orders stack up.
Use volume filters to focus only on relevant levels — and group data for volatile assets so you don’t miss key setups.
It’s built for traders who want precision, not guesswork.
Features & Setups
1. Footprint Terminal
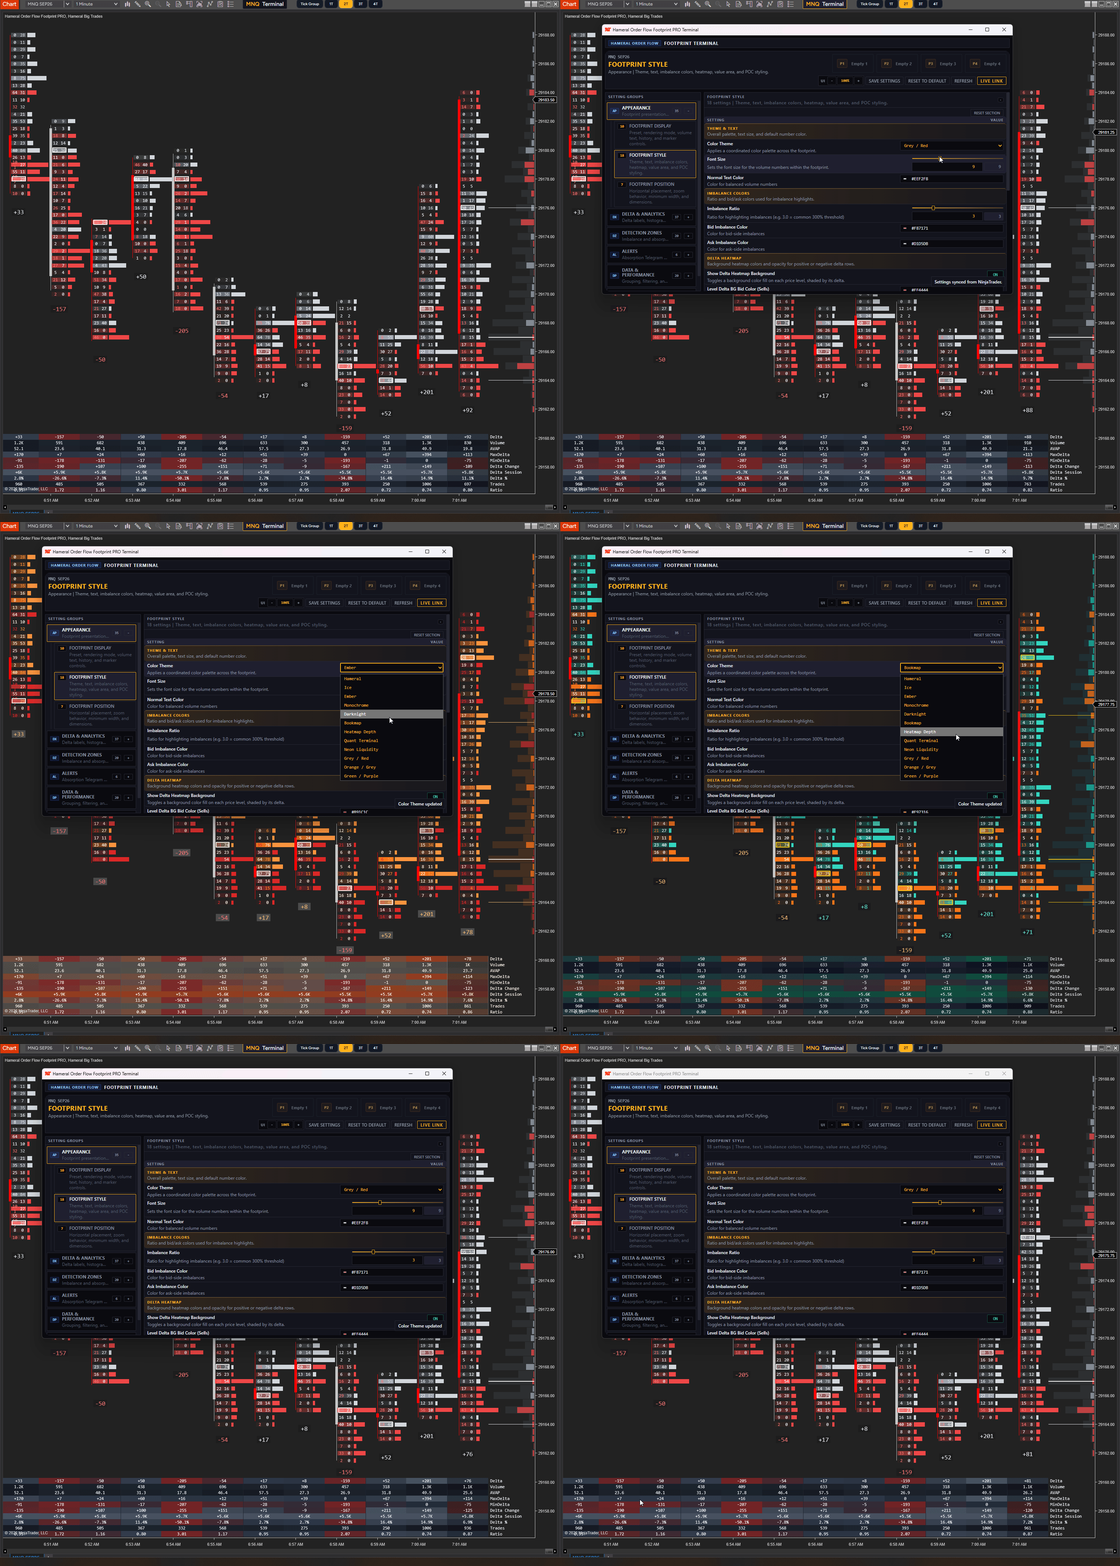
Hameral Footprint PRO includes an advanced, user-friendly Footprint Terminal where you can customize your footprint in real time without waiting for the indicator to reload after every small change.
You can modify the layout, colors, filters, profiles, delta tools and display options directly from the terminal and see the changes live on the chart.
- Advanced Footprint Terminal for faster customization
- Modify footprint settings in real time
- See your changes live on the chart
- Use ready-made templates directly from the terminal
- Save your own templates inside the terminal
- Load your saved presets whenever you need them
- Reset all settings or only specific sections
- Organized categories for Appearance, Delta & Analytics, Detection Zones, Alerts, Data and Performance
- More than 100 available settings for deep footprint customization
- Optimized code designed to keep the indicator fast despite its advanced functionality
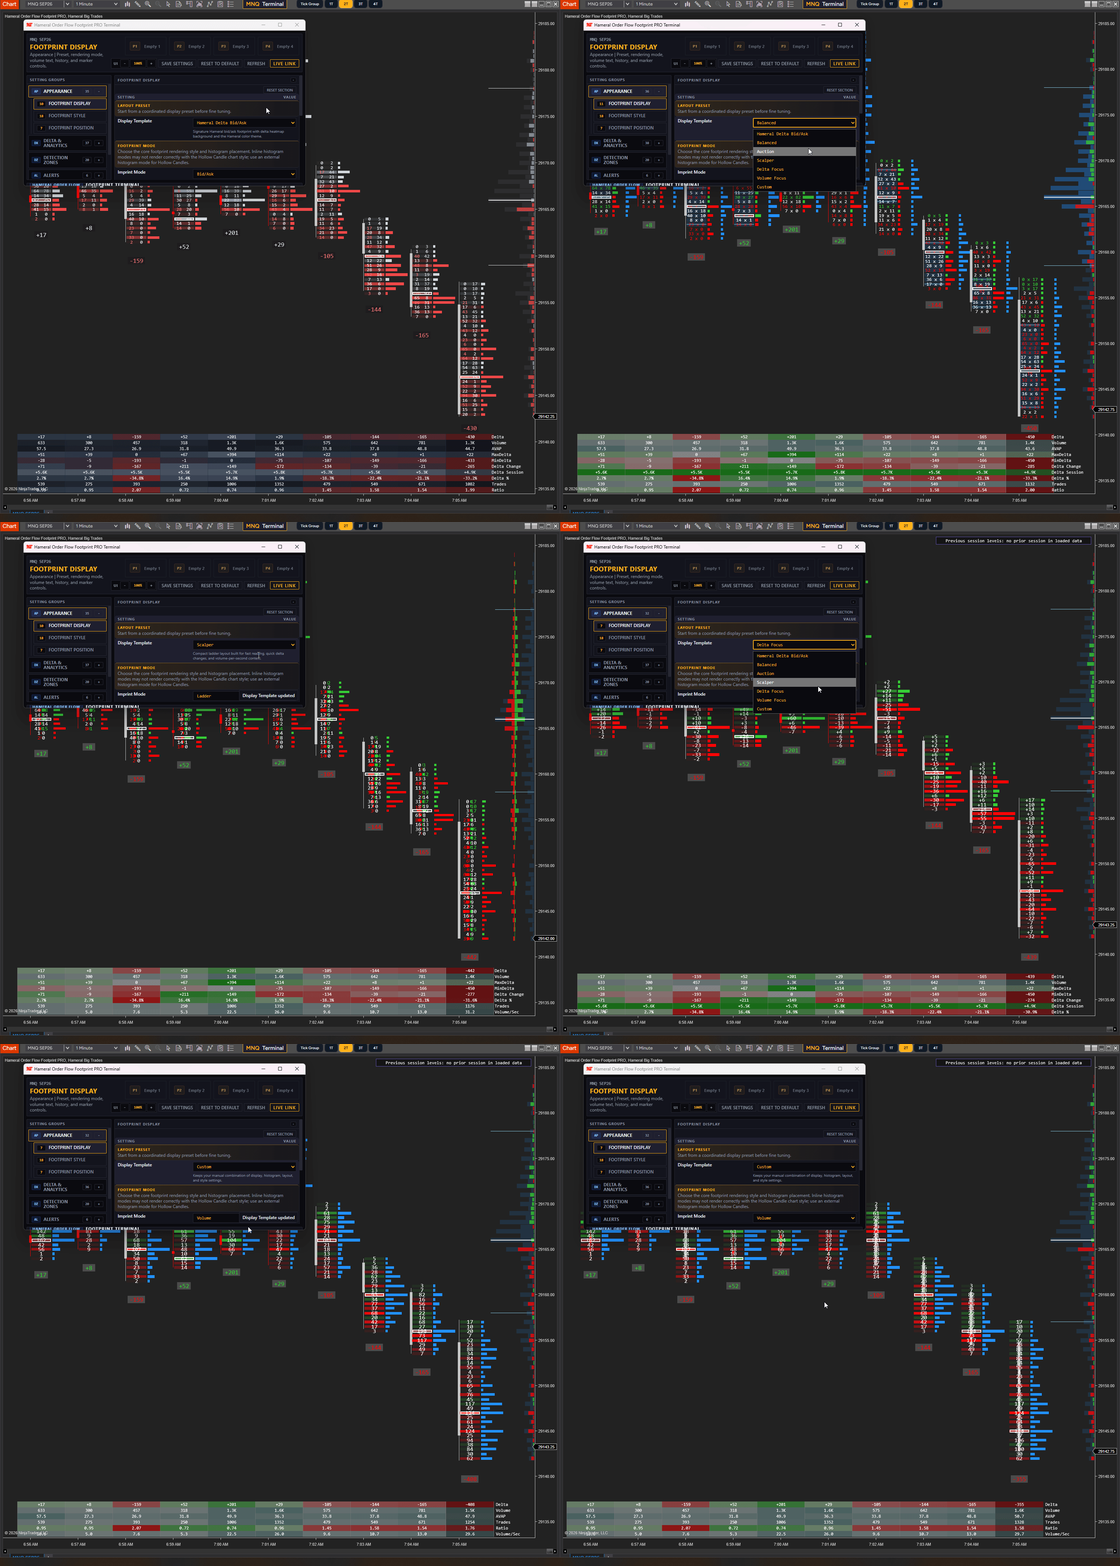
2. Ready-Made Layouts for Different Trading Styles
Save time with ready-made footprint layouts, so you don’t have to build your setup from zero.
Choose the view that matches your trading style:
- Classic Bid/Ask – read aggressive buyers and sellers inside each candle.
- Volume Focus – focus on total volume and high-activity price levels.
- Delta Focus – highlight buying and selling pressure first.
- Scalper Layout – compact ladder-style footprint for fast intrabar reading.
- Auction Layout – volume-based view with daily profile context.
- Custom Layout – build your own footprint setup.
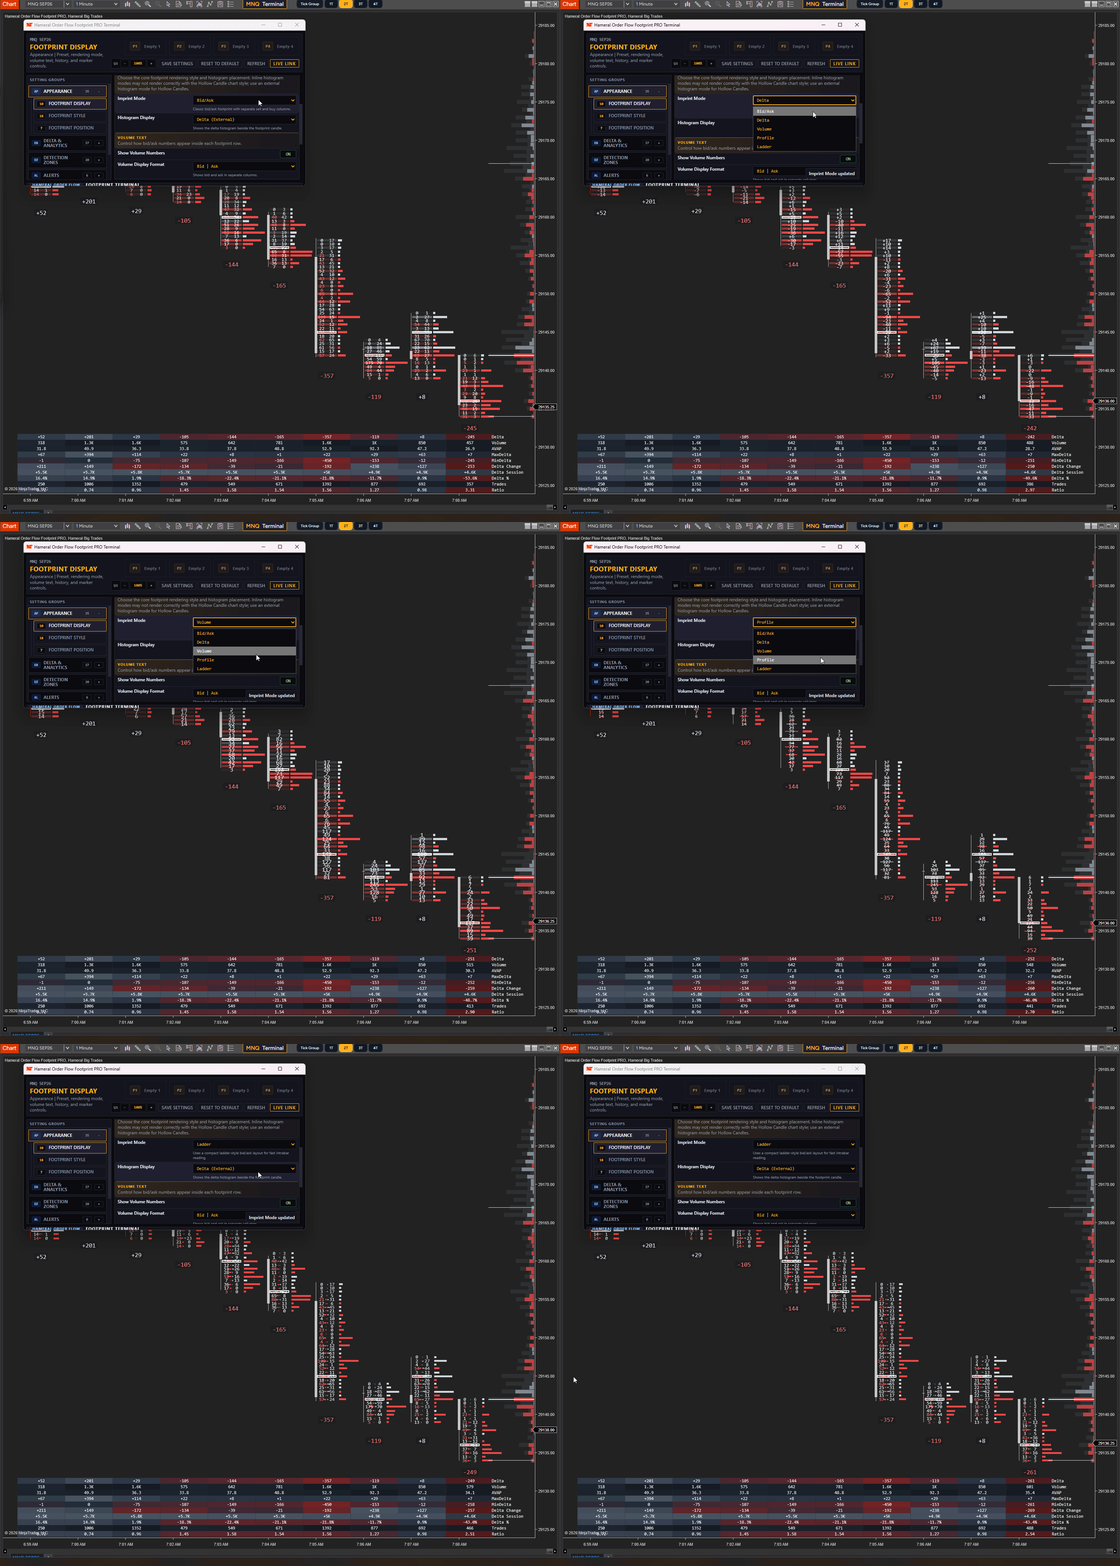
3. Multiple Imprint Modes Inside the Candles
Choose what type of order flow data you want to see inside each candle: bid/ask, total volume, delta, profile or ladder view.
- Classic Bid/Ask – see aggressive buyers and sellers at each price level.
- Total Volume – display total traded volume without splitting bid and ask.
- Delta – focus on the difference between buying and selling pressure.
- Profile – combine volume numbers with a histogram-style display.
- Ladder – combine bid/ask numbers with visual bars for faster intrabar reading.
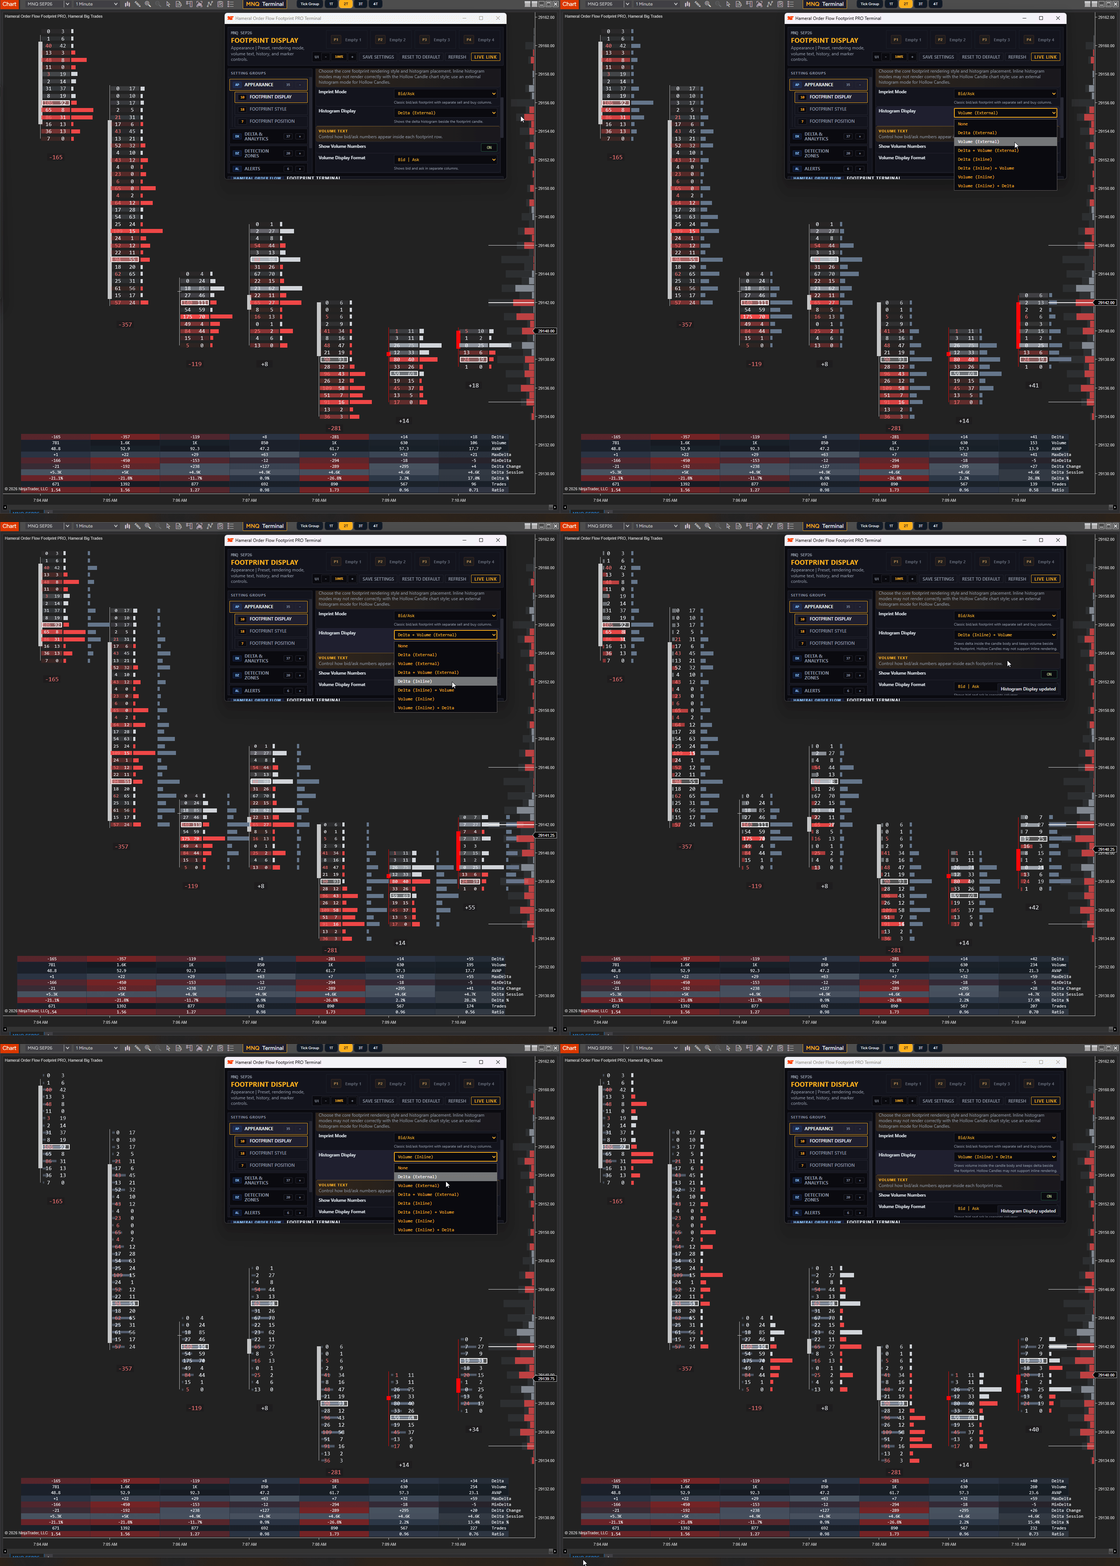
4. Attached Delta and Volume Histograms
Add visual histograms to read volume and delta pressure faster, directly beside or inside the footprint candle.
- Delta Histogram – visualize positive and negative delta pressure beside or inside the footprint candle.
- Volume Histogram – see total volume distribution for each candle in a faster visual format.
- Delta + Volume Together – display both delta and volume histograms at the same time.
- External Position – place the histogram on the right side of the footprint for a clean separated view.
- Inline Position – display the histogram inside the candle for a more compact layout.
- No Histogram – keep the footprint clean and show only the imprint values.
- Custom Styling – adjust histogram width, offset, thickness and colors.
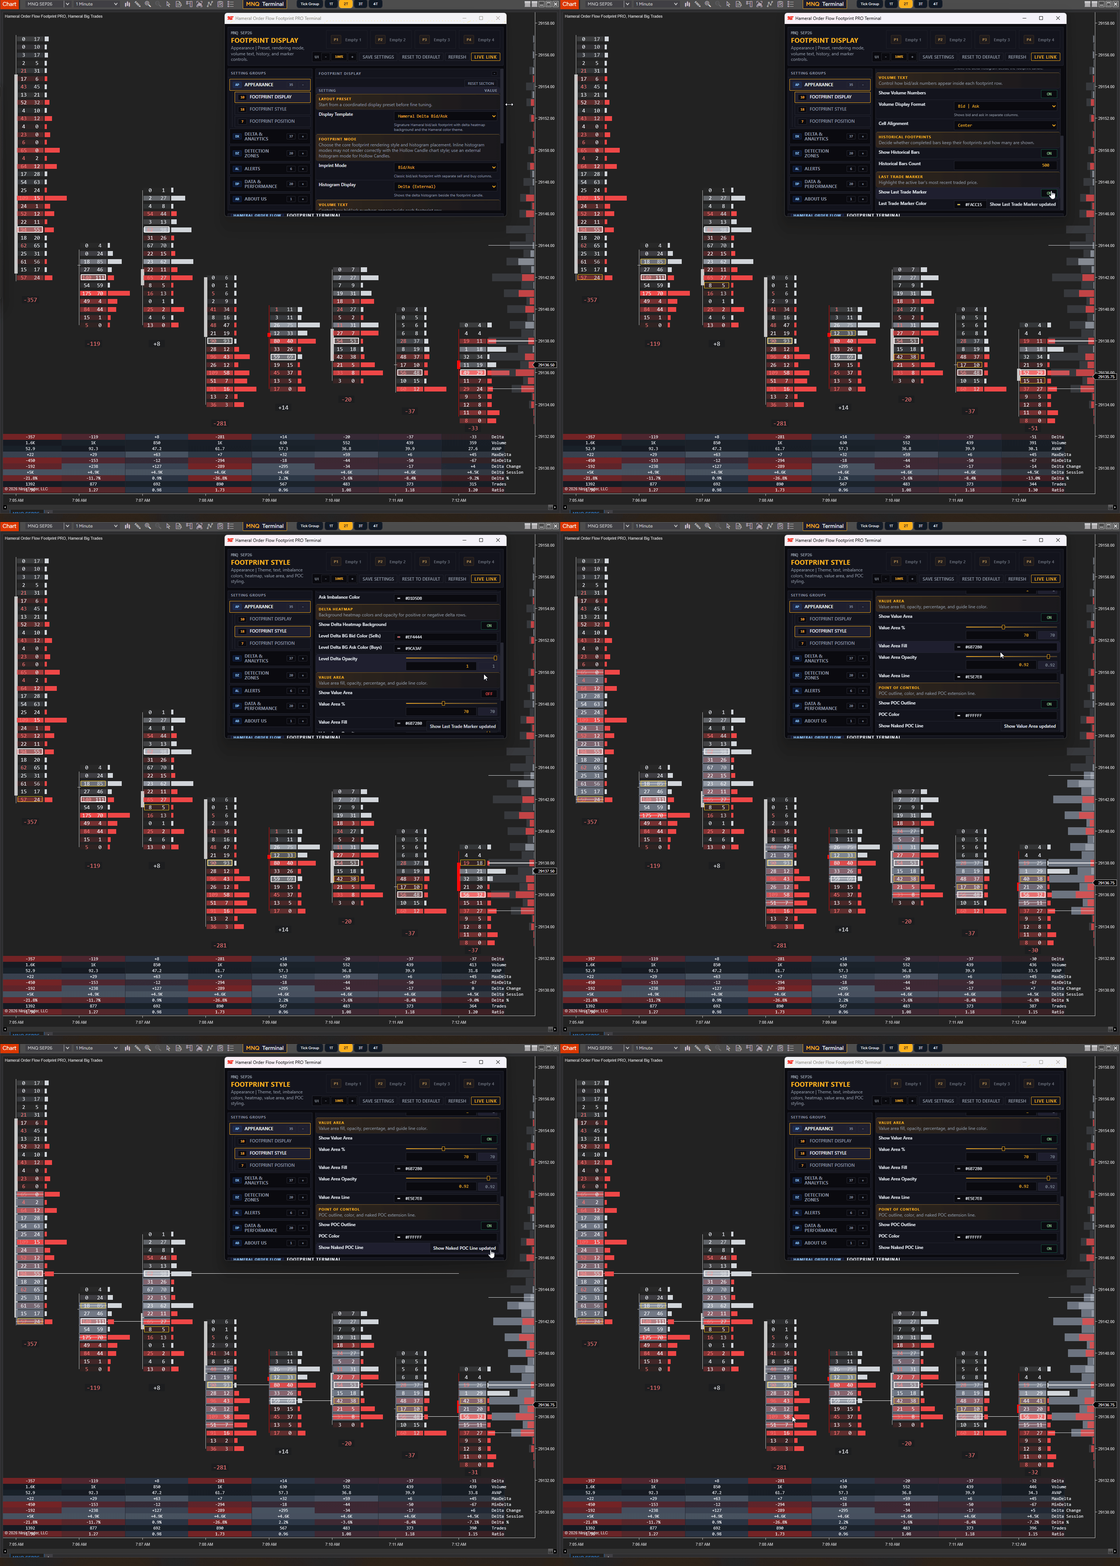
5. Advanced Footprint Features
Use advanced visual tools to highlight key volume, delta and aggression areas inside each candle.
- Historical Bars Control – choose how many completed footprint bars are displayed on the chart.
- Imbalance Ratio – define the ratio used to highlight strong bid or ask imbalances.
- Delta Heatmap Background – see buying and selling aggression through background color intensity.
- Value Area Highlight – highlight the value area of each candle based on traded volume.
- POC Outline – mark the price level with the highest traded volume inside the candle.
- Naked POC Line – extend untouched POC levels to the right until price interacts with them.
- Last Trade Marker – highlight the most recent traded price on the active footprint candle.
- Tick Grouping – group multiple ticks into one row for a cleaner display on high-volatility assets or bigger timeframes.
6. Delta and Analytics
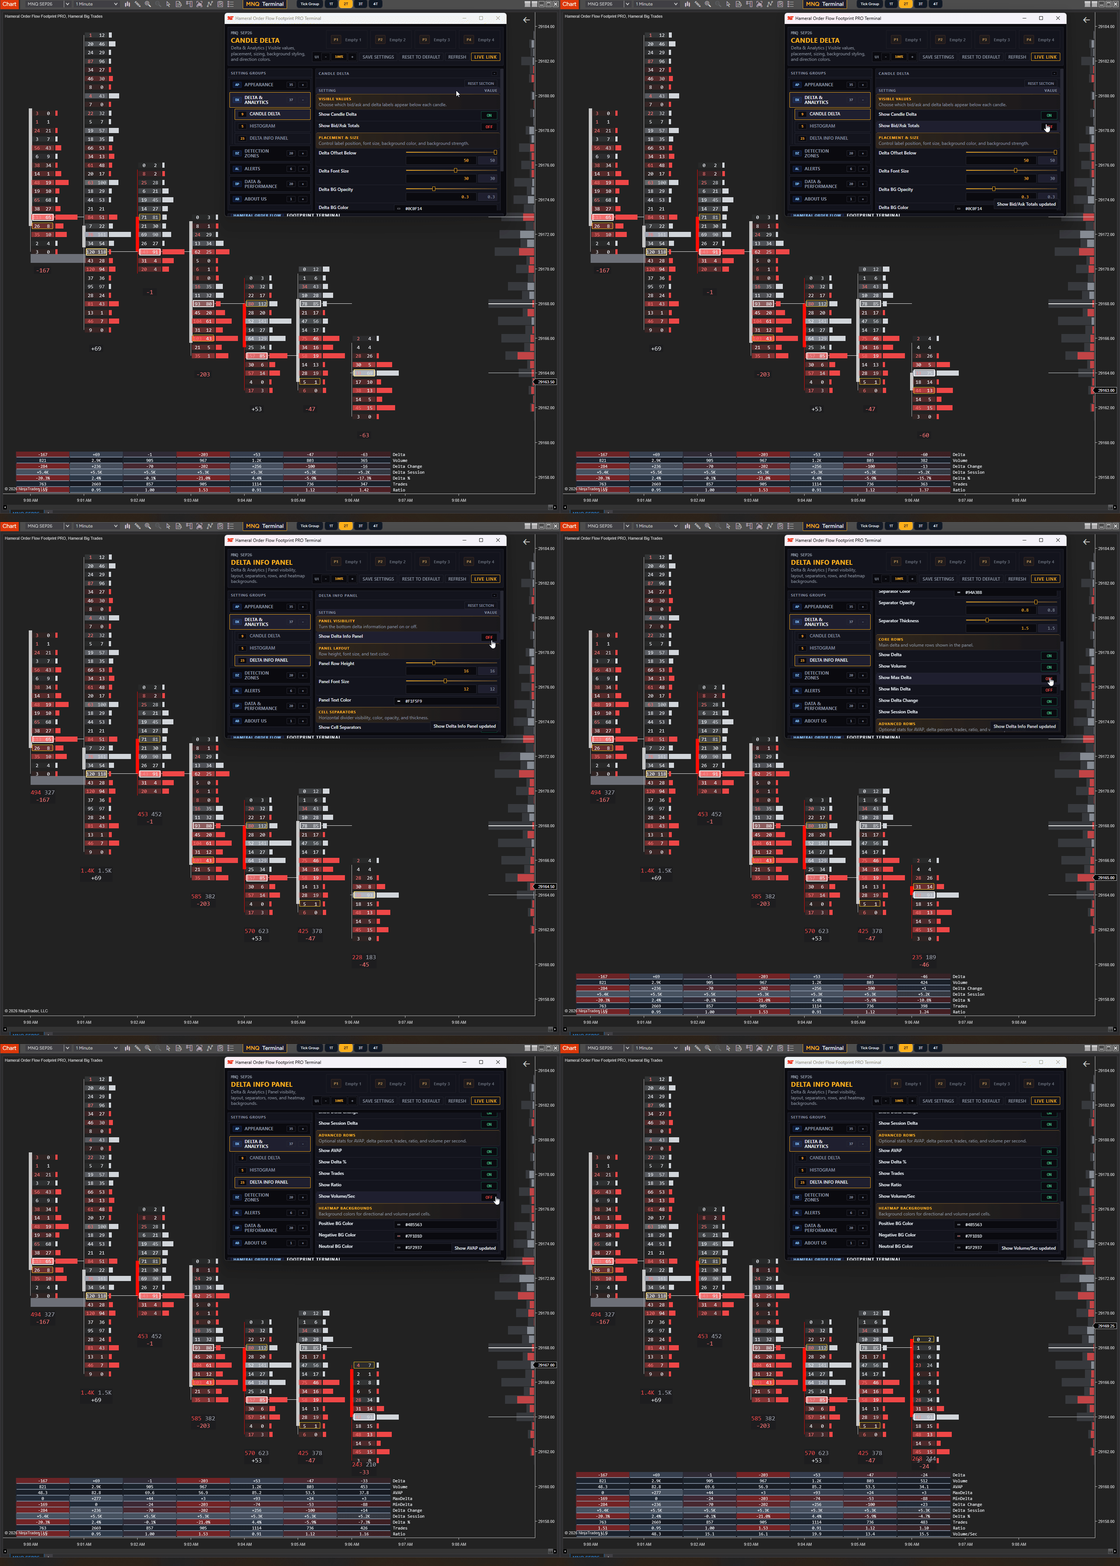
Track advanced delta, volume and trade activity in a clean analytics table below the chart.
- Advanced Delta Table – display key candle statistics directly below the chart.
- Delta Change – compare the current candle delta with the previous candle delta.
- Min Delta – see the lowest intrabar delta reached during the candle.
- Max Delta – see the highest intrabar delta reached during the candle.
- Session Delta – track cumulative delta for the trading session.
- AVAP – display Average Volume at Price for each candle.
- Delta % – see delta as a percentage of total candle volume.
- Bid/Ask Ratio – compare selling pressure versus buying pressure.
- Trades Count – see the number of trades inside each candle.
- Volume per Second – measure how fast volume is coming into the candle.
- Candle Delta – display total delta directly below each candle.
- Bid/Ask Totals – optionally split the candle totals by bid and ask volume.
7. Automatic Detection Zones
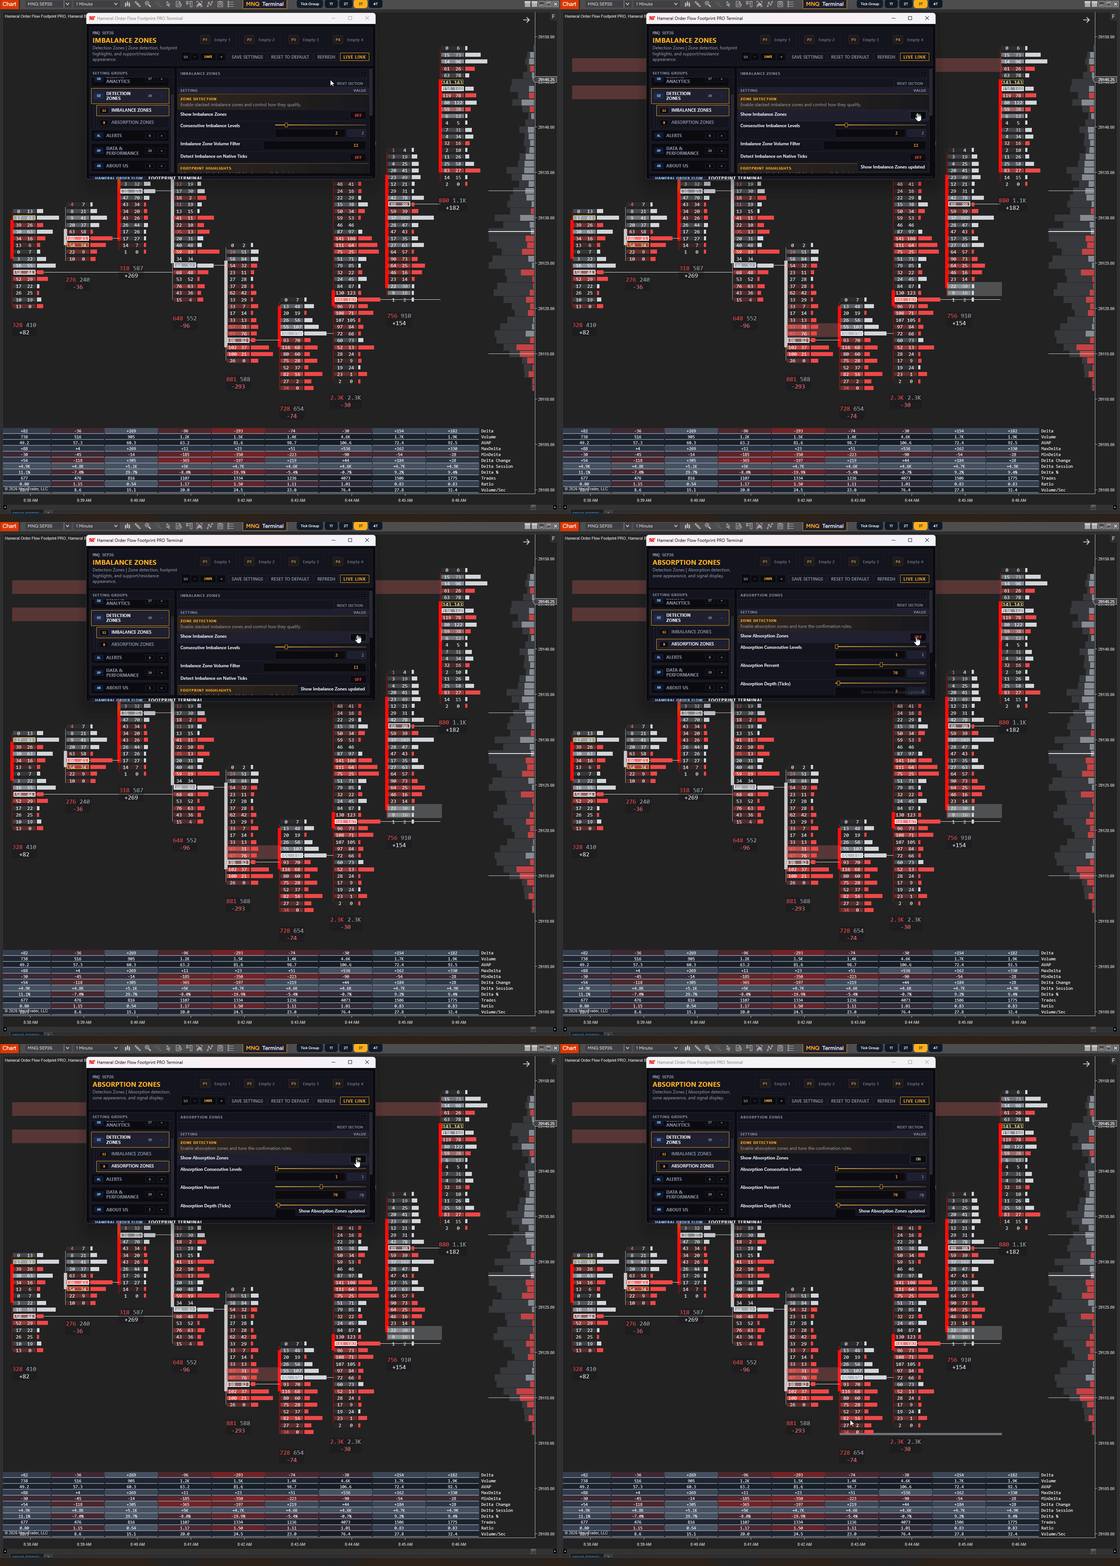
Automatically detect and plot important order flow zones directly on the chart.
- Stacked Imbalance Zones – automatically detect consecutive bid or ask imbalances and plot them as support or resistance zones.
- Custom Imbalance Settings – control the number of consecutive levels, imbalance ratio and volume filter required to create a zone.
- Absorption Zones – automatically detect absorption at the top or bottom of the candle when aggressive pressure fails to continue price.
- Support and Resistance Projection – plot detected imbalance and absorption areas directly on the chart as visual zones.
- Native Tick Detection – detect zones using native tick resolution for more precise analysis.
- Custom Zone Appearance – adjust zone colors, opacity and visibility to match your chart style.
- Stop Zone on Touch – choose whether imbalance zones should stop drawing after price touches them.
8. Absorption Alerts
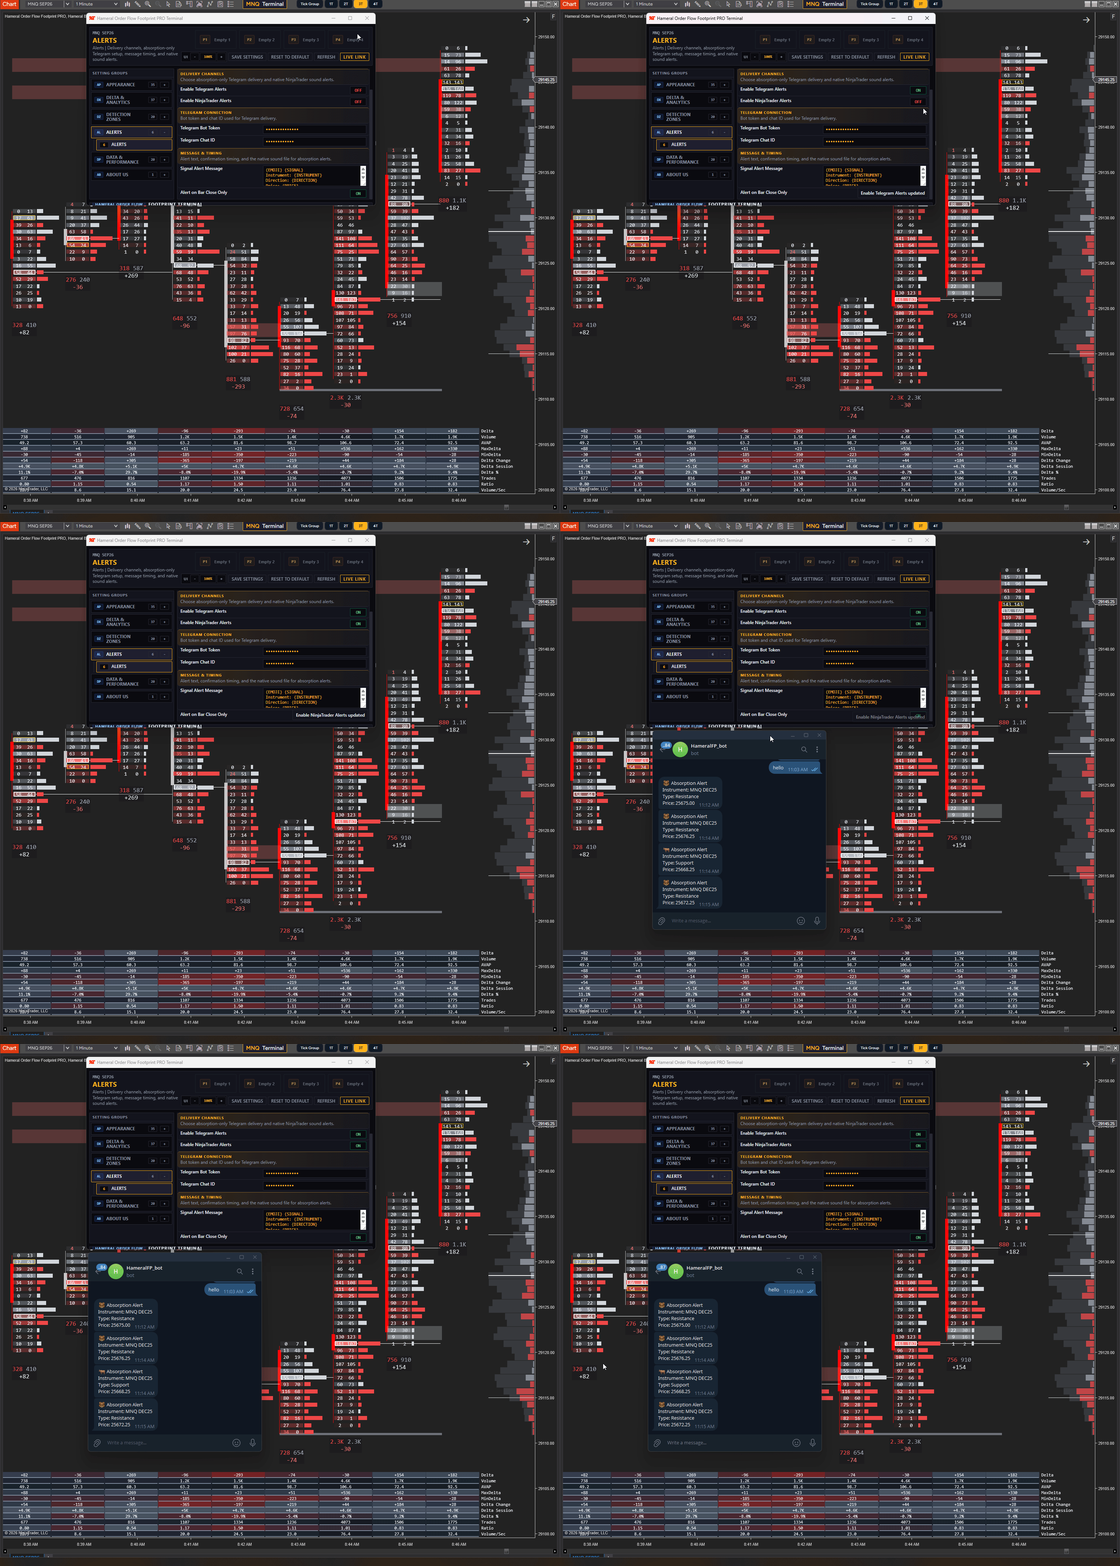
Get notified when absorption is detected on the chart, without watching every candle manually.
- Telegram Bot Alerts – receive Telegram messages when absorption appears on the chart.
- NinjaTrader Sound Alerts – play a sound alert directly inside NinjaTrader when absorption is detected.
- Absorption-Based Alerts – alerts are focused on absorption events detected by the indicator.
- Custom Alert Message – personalize the alert text using instrument, signal, direction, price and emoji placeholders.
- Bar Close Confirmation – choose if alerts should trigger only after the candle closes.
9. Price Profile on the Right Side of the Chart
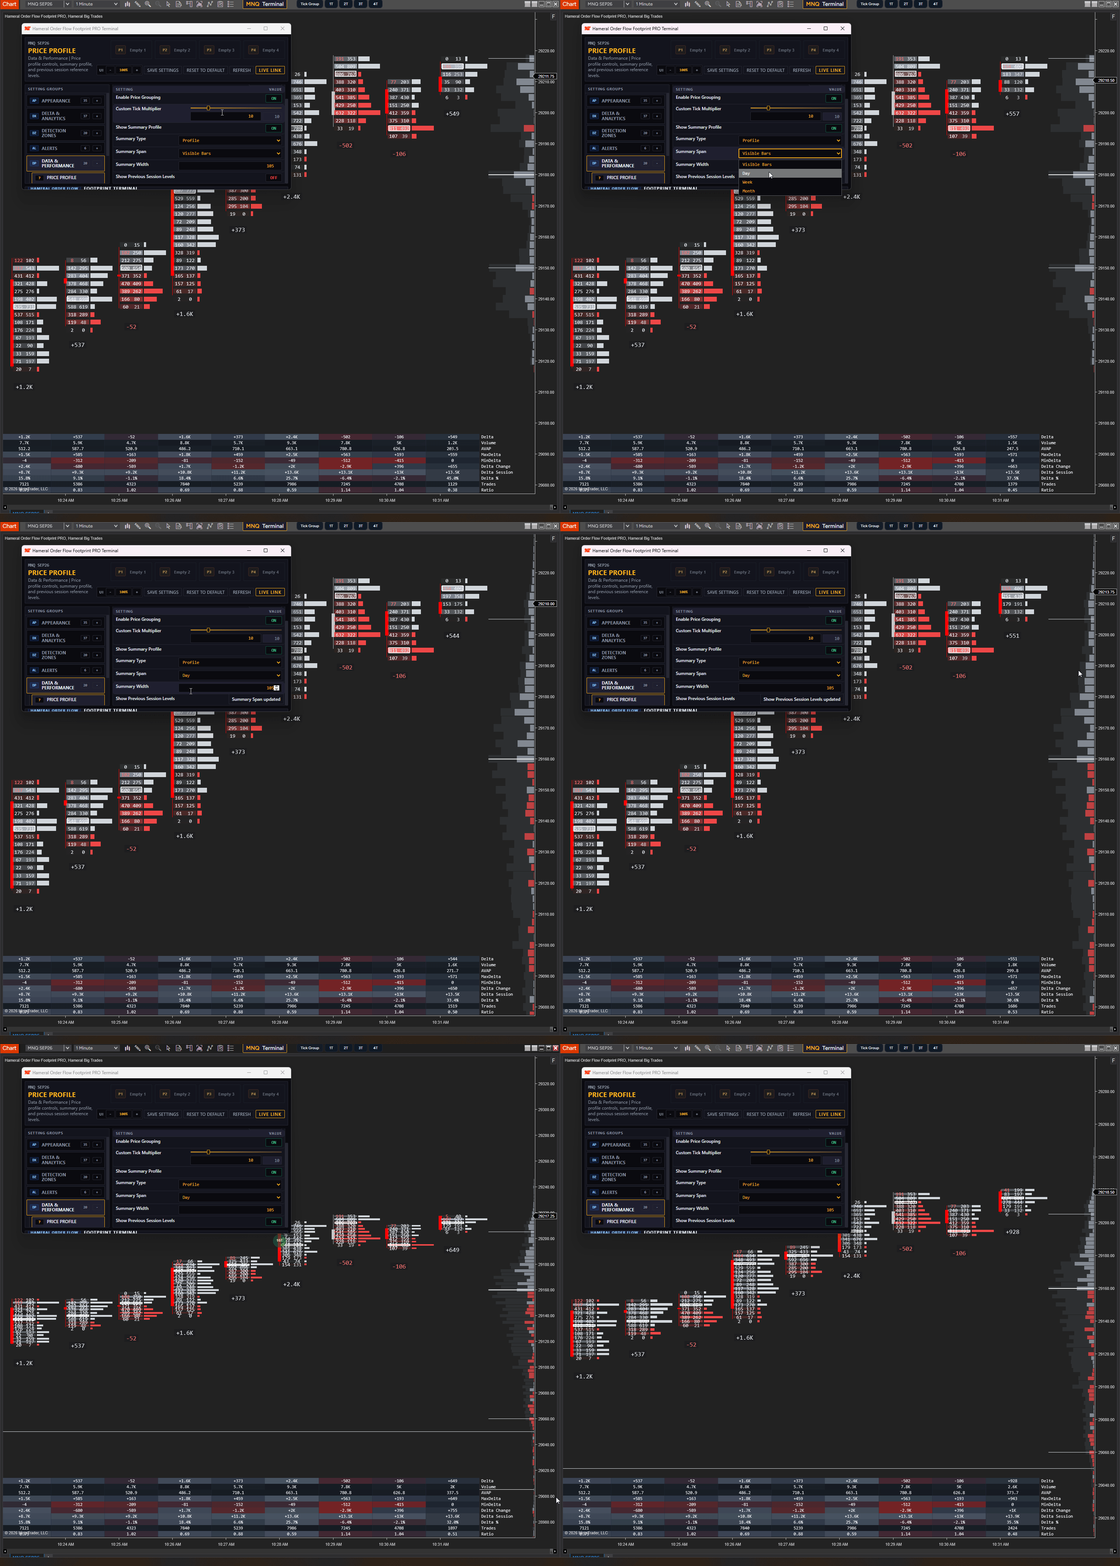
Display a right-side price profile to see where volume has traded beyond a single candle.
- Right-Side Price Profile – display an aggregated profile next to your footprint candles.
- Profile Display Mode – show volume distribution in a classic profile-style view.
- Ladder Display Mode – use a ladder-style profile for a more compact order flow view.
- Visible Bars Profile – calculate the profile from the bars currently visible on the chart.
- Daily Profile – show daily profile context directly beside the footprint chart.
- Weekly Profile – analyze broader weekly volume distribution.
- Monthly Profile – display higher-timeframe profile context for bigger market structure.
- Previous Session Levels – optionally show previous session VAL, VAH and POC reference lines.
10. Trade and Value Filtering
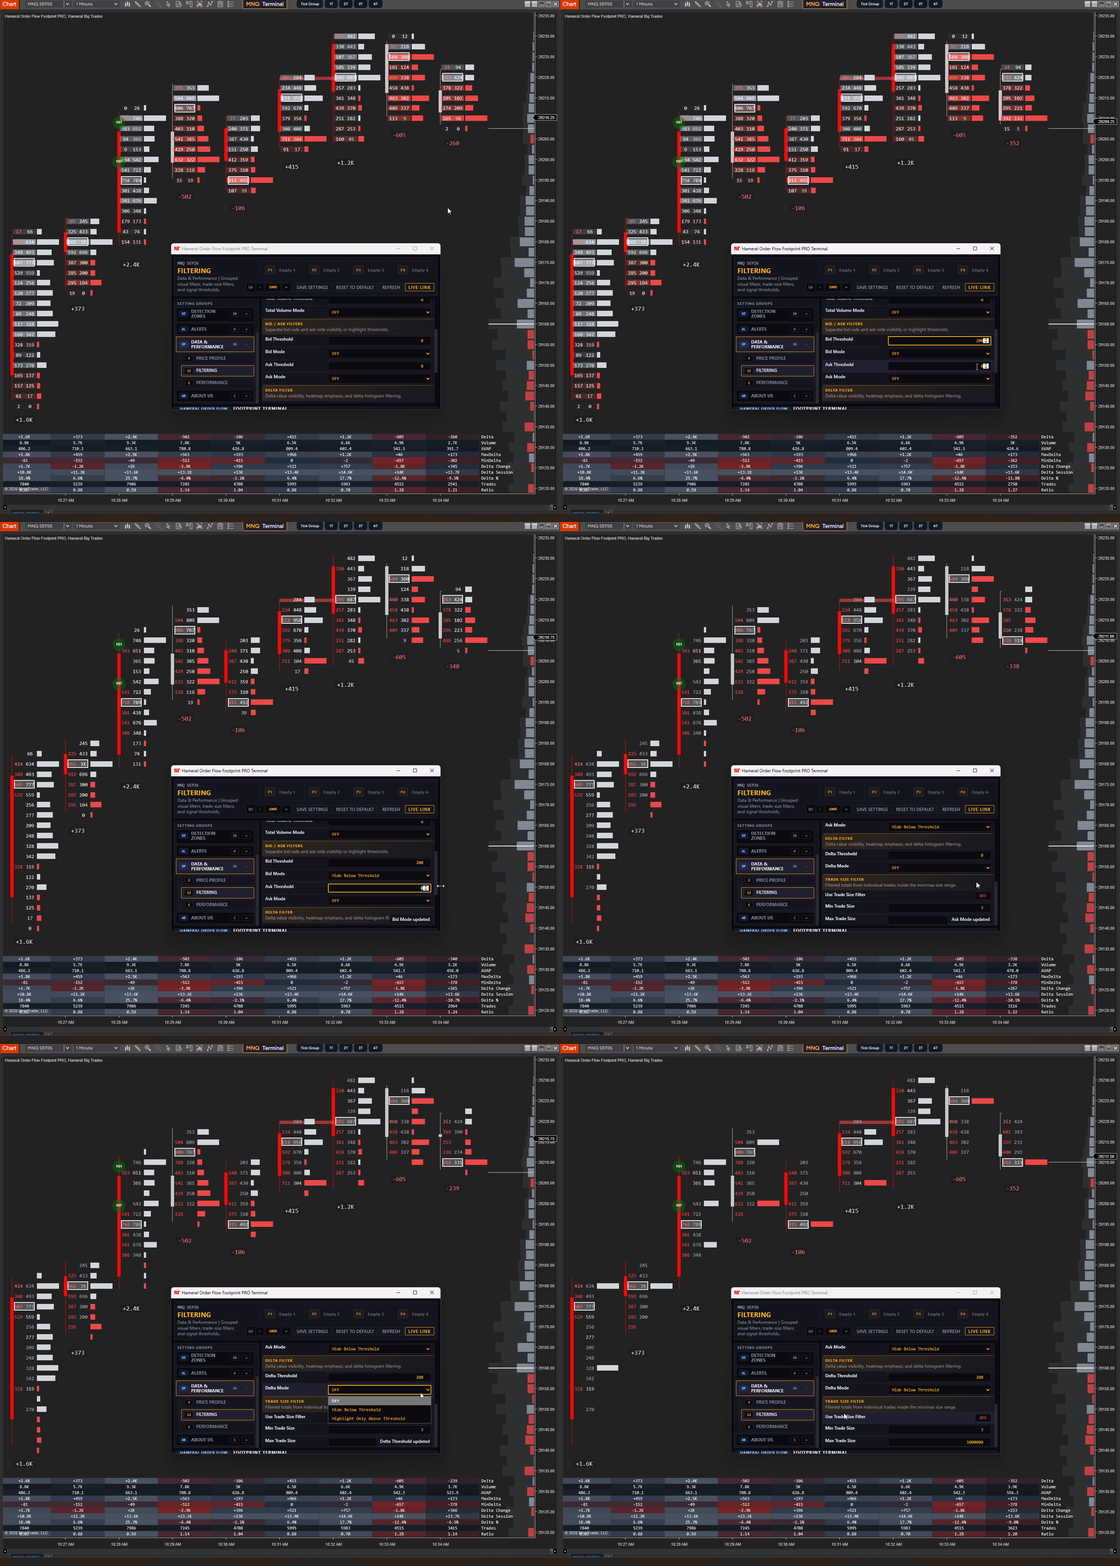
Filter the footprint to focus only on the values that matter to your trading.
- Zero Values – show or hide 0 imprints inside the footprint candles.
- Volume Filter – show or highlight volume only when it is above your selected threshold.
- Delta Filter – show or highlight delta only when it is above your selected threshold.
- Bid Filter – show or highlight bid-side volume only when it is above your selected value.
- Ask Filter – show or highlight ask-side volume only when it is above your selected value.
- Hide Below Threshold – remove smaller values from the footprint for a cleaner chart.
- Highlight Only Above Threshold – keep values visible but highlight only the important ones.
- Trade Size Filter – track filtered totals using custom minimum and maximum trade size settings.
11. Infinite Display Possibilities
Customize the footprint display to fit your chart, trading style and workspace.
- Zooming Options – control how the footprint behaves when you zoom in or out on the chart.
- Auto Scale with Zoom – automatically adjust the footprint size based on chart zoom.
- Custom Display Placement – position the footprint around the candle with custom offset controls.
- Footprint Offset – move the footprint to the right for better visual alignment.
- Adjustable Footprint Width – control the minimum width of the footprint display.
- Minimum Width Scaling – keep the footprint readable even when the chart is compressed.
- Hide on Deep Zoom Out – automatically hide footprint details when the chart becomes too compressed to read clearly.
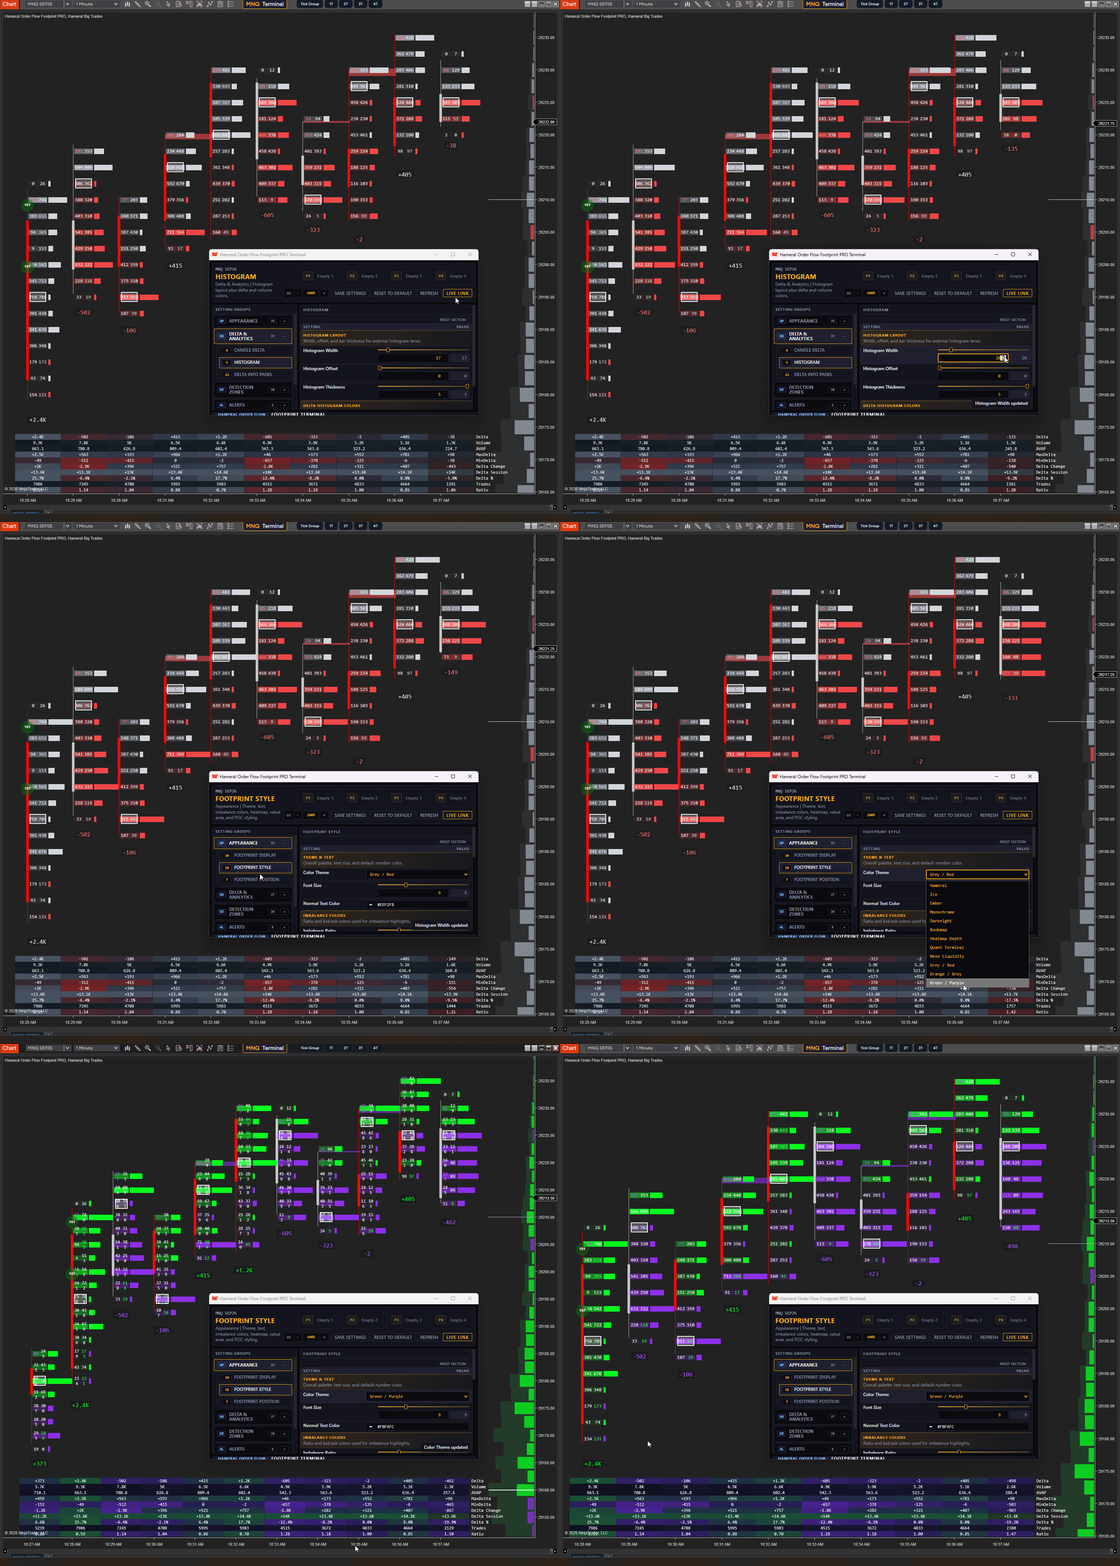
- Histogram Width – adjust the size of the attached delta or volume histogram.
- Histogram Thickness – control the thickness of each histogram bar.
- Histogram Offset – adjust the distance between the footprint and the histogram.
- Custom Colors – customize delta, volume, bid, ask, POC, Value Area, imbalances, absorption zones, text and panel colors.
12. Performance and Optimization
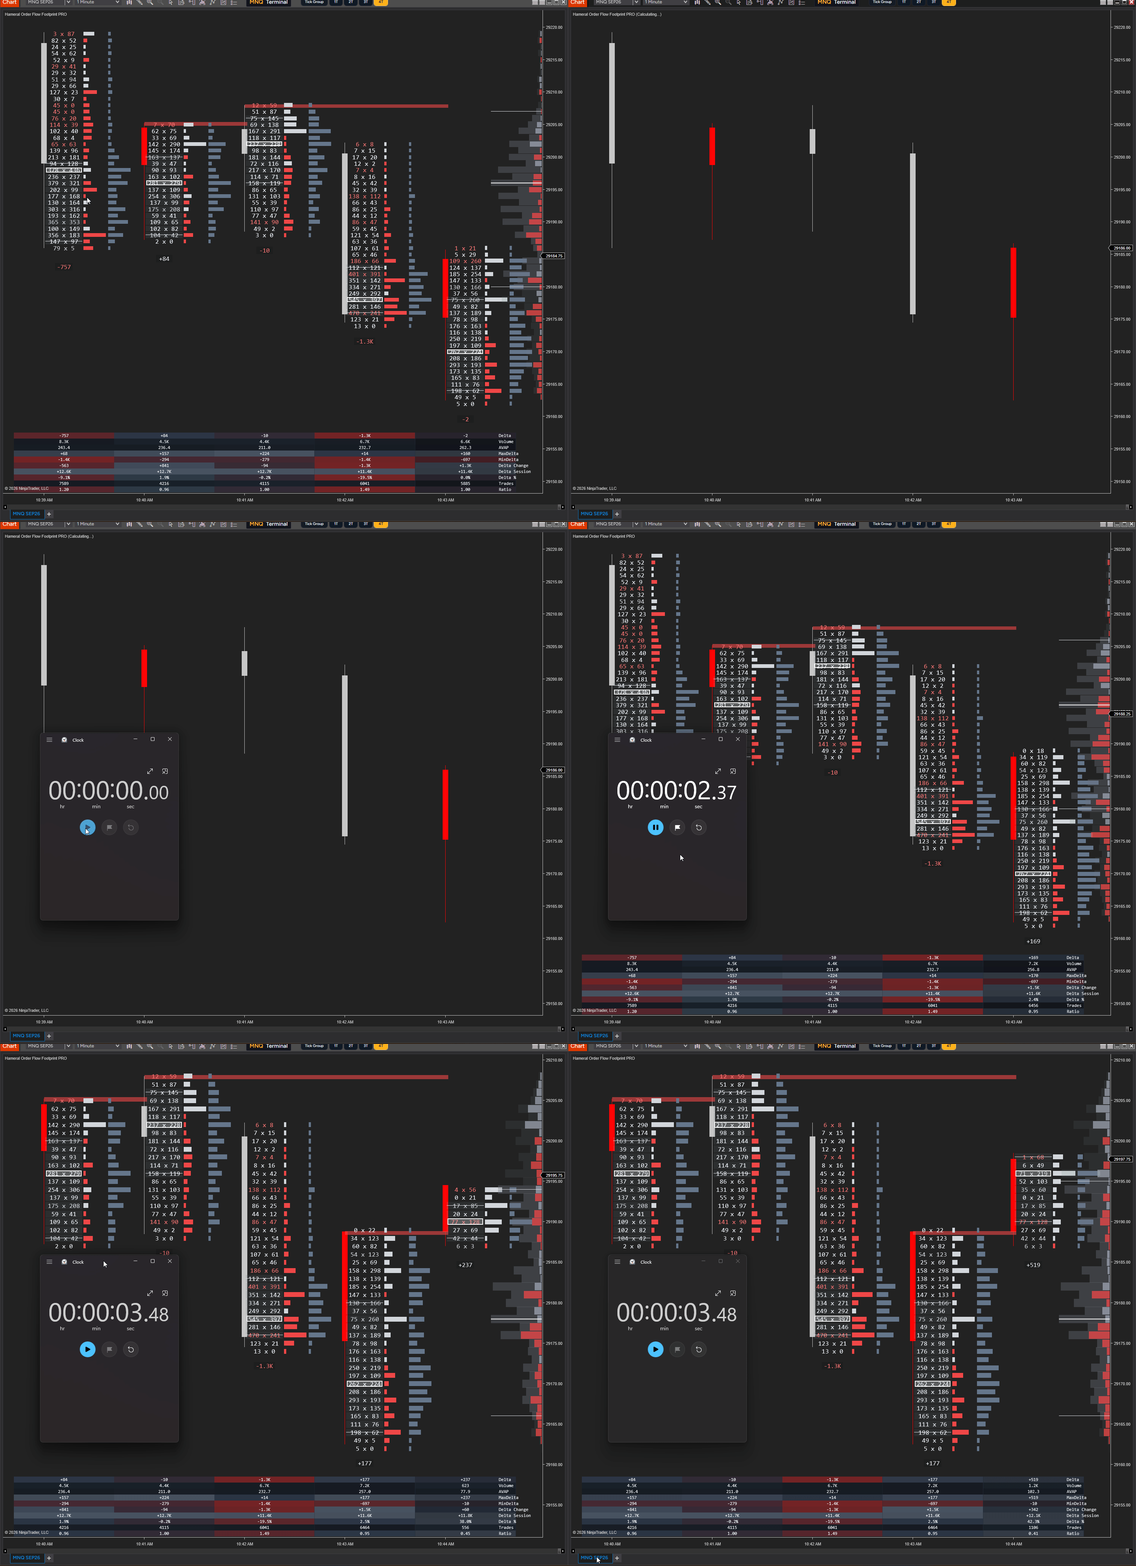
Built to handle advanced footprint data while keeping the chart responsive.
- Optimized Tick Replay Processing – designed to handle historical footprint reconstruction more efficiently.
- Historical Bars Control – choose how many footprint bars are displayed on the chart.
- Maximum Price Levels per Bar – limit the number of processed price levels to help protect performance.
- Old Bar Cleanup Logic – keeps chart memory more controlled during long sessions.
- Deep Zoom Protection – hide footprint details when the chart is too compressed to read clearly.
- Price Grouping Option – reduce visual and processing load by grouping multiple ticks into one row.
- Fast Real-Time Adjustments – modify many settings from the Footprint Terminal without constantly reloading the indicator.
Important Note
For historical bid/ask footprint reconstruction, Tick Replay must be enabled in NinjaTrader. Without Tick Replay, historical footprint data may be incomplete until real-time market data starts coming in.
Recommended Use
For best performance, load only the historical bars you need, use Tick Replay when you want historical footprint data, and adjust Tick Grouping or Historical Bars Count depending on your instrument, timeframe and computer performance.
Examples

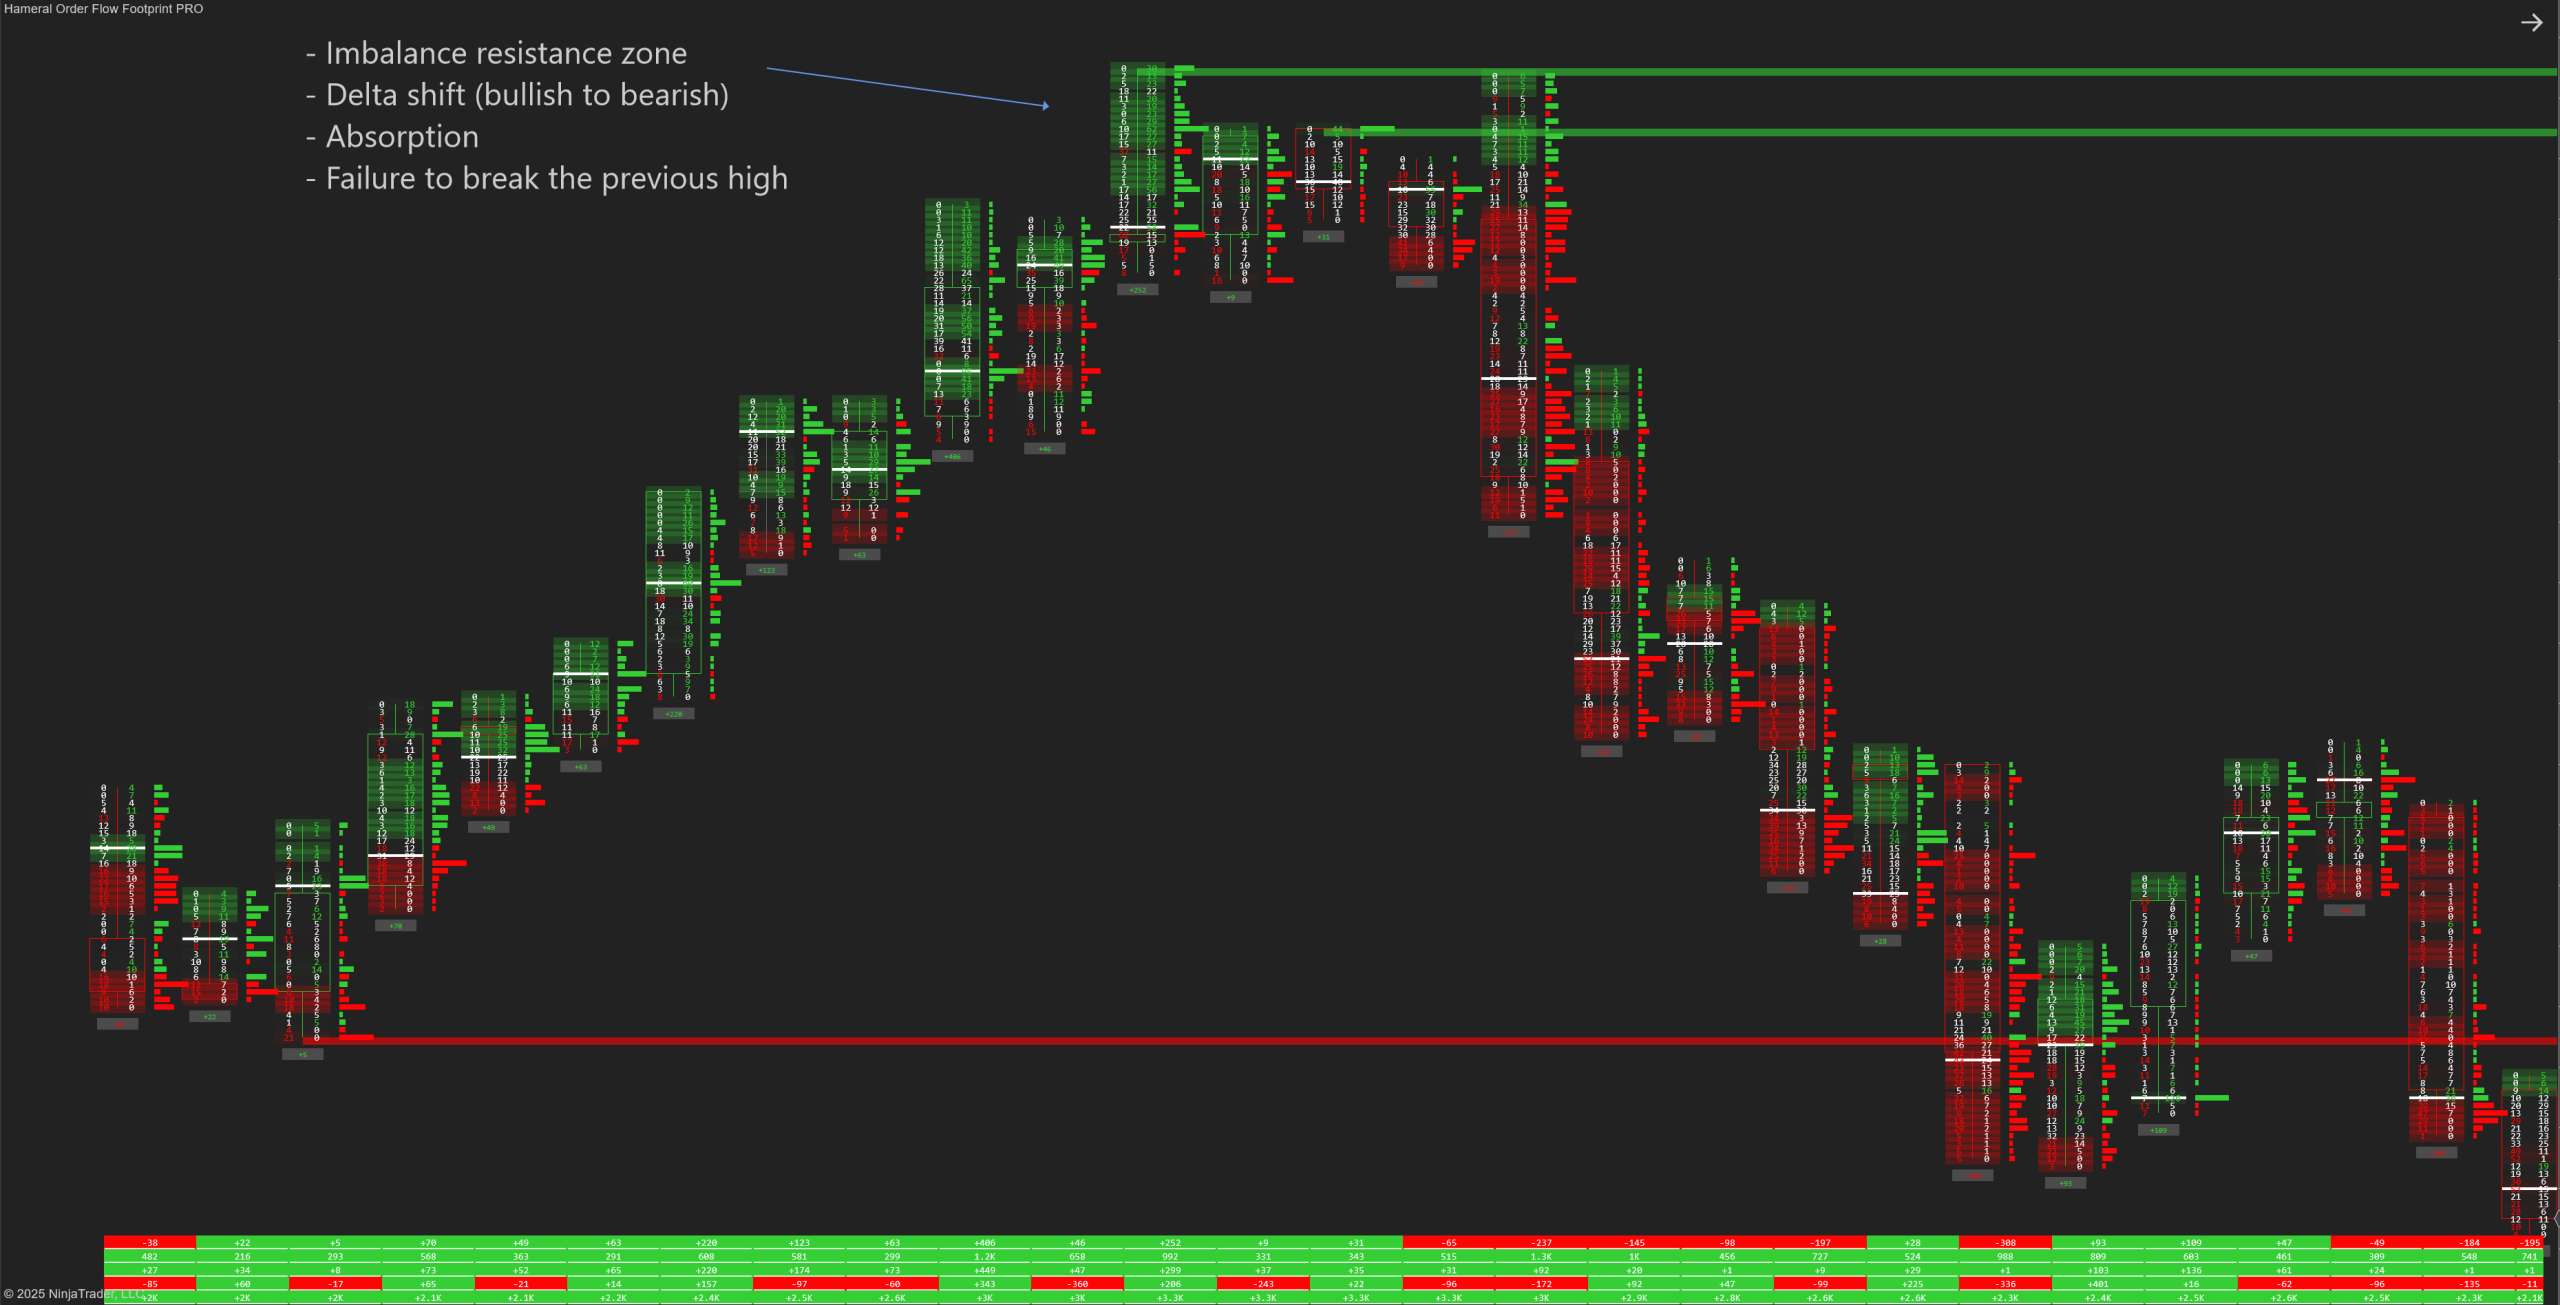
Price reached a key level and attempted a breakout. However, at the top, we observed heavy buy orders trying to push the price higher – but with no success.
The Footprint chart plots clear absorption at the highs. Price then closed below the POC, and both the Delta Bar and Delta Change are negative – signaling a potential reversal.