
Hameral Anchored VWAP
Hameral Anchored VWAP tracks the true average price from a chosen starting point, showing where real market control and value have been established.


✔️LifeTime License ✔️ Free Updates ✖️ No Order Flow+ Needed
🛡️Secured SLL Checkout
💳 All Major Cards
✖️ VAT Not Included
Description
Start from the event that matters. Follow its volume-weighted price. Hameral Anchored VWAP lets you choose a starting bar on your NinjaTrader 8 chart and track the volume-weighted average from that point through the available chart data.
Anchor the calculation at a swing high, a swing low, a breakout or the beginning of a move you want to study. Instead of relying only on a session-based reference, give your analysis a starting point that matches the market event.
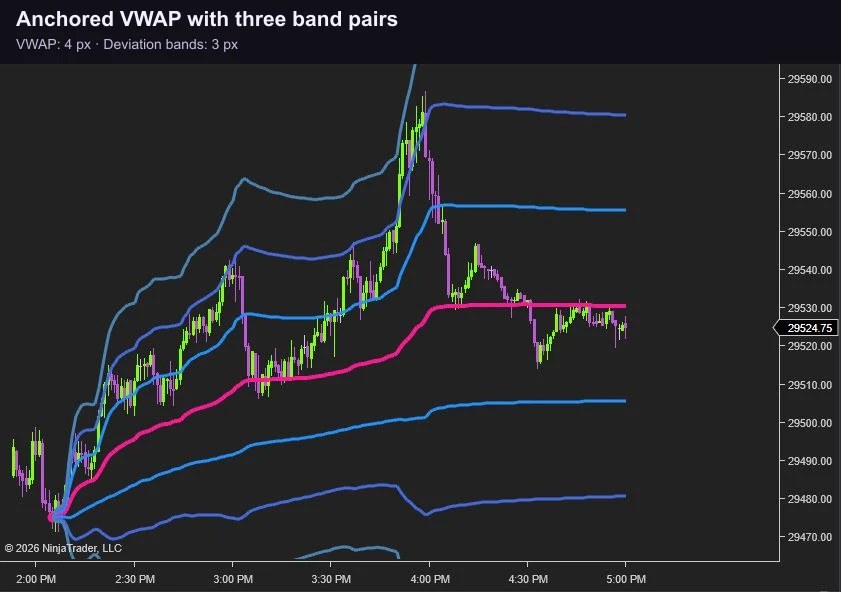
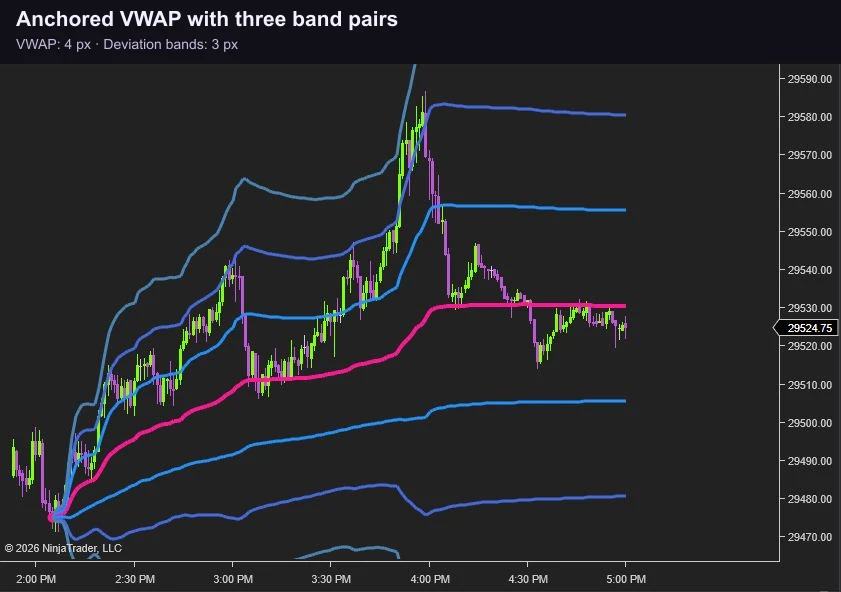
Choose High, Low or Median as the price input, add up to three pairs of configurable standard-deviation bands, and customize the lines to suit your workspace. Move the anchor to test a different starting point and see the reference recalculate.
Features & Setup
Choose the starting point on your chart
Put the reference where your analysis begins. Select Hameral Order Flow Anchored VWAP from Drawing Tools and click the bar you want to use as the start. The VWAP then runs forward from that anchor through the loaded chart bars.
Use a significant high or low, a breakout bar, or another event relevant to your analysis. Select the anchor marker and drag it to another bar to recalculate the reference from a different starting point.
Useful context: compare current price with the volume-weighted reference since your chosen event. The reference is an analytical aid; a touch or crossing does not guarantee a price reaction.
High, Low or Median — choose your price input
Use Input Price Type to choose the price used for every bar in the calculation:
- High: weight each bar’s high by its volume.
- Low: weight each bar’s low by its volume.
- Median: use (High + Low) ÷ 2, weighted by volume.
The tool also detects the initial input from the anchor’s position: placing it near or below a bar’s low selects Low; near or above its high selects High; between them selects Median. Moving the anchor can select the input again, so check Input Price Type after repositioning it.
The result depends on the chart’s bar interval and the history loaded from the anchor onward. Keep these consistent when comparing inputs or starting points.
Add the deviation bands you want to see
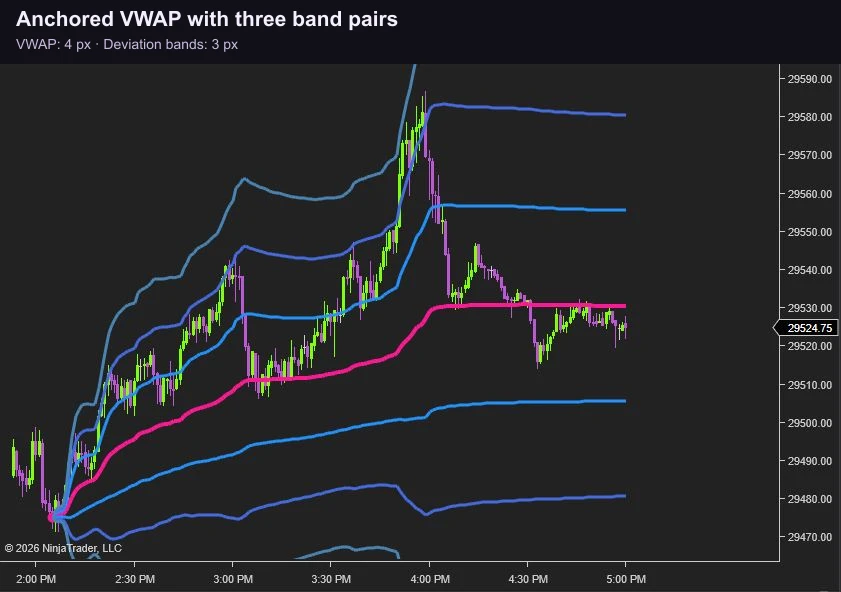
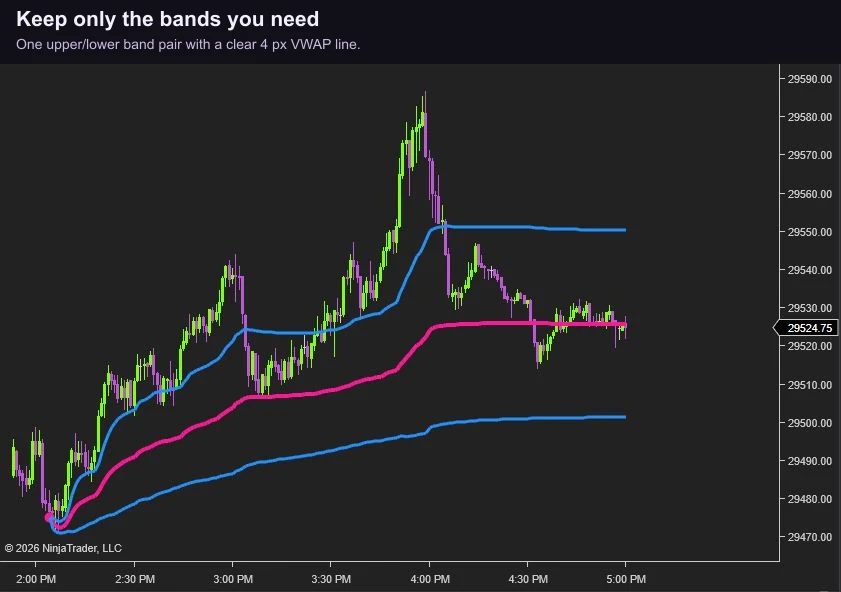
See the distance from your anchored VWAP. Display up to three upper/lower pairs of volume-weighted standard-deviation bands. Each pair has its own visibility switch, multiplier and stroke settings.
The default multipliers are 1, 2 and 3. Each accepts a value from 0.1 to 10, so you can adjust the distances independently rather than using a fixed band layout.
In Drawing Objects, open Bands and use Show 1σ Bands, Show 2σ Bands and Show 3σ Bands. Adjust the corresponding multiplier and stroke for each pair. Turn the pairs off when you want a clean VWAP-only view.
Customize the VWAP and each band pair
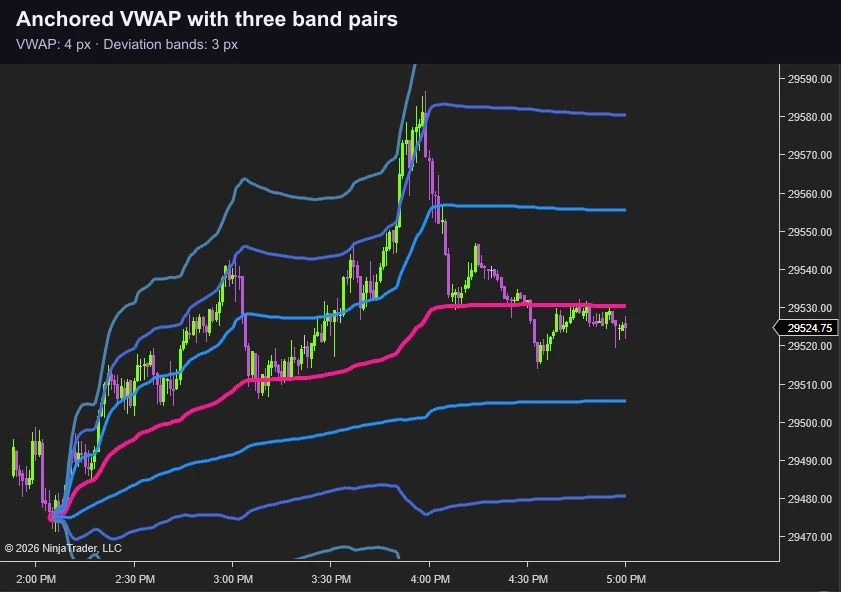
Make the reference easy to distinguish on your chart. Under General → Line, choose the anchored VWAP’s color, width, opacity and dash style. The anchor marker uses the VWAP line’s color.
Style each band pair separately with 1σ Stroke, 2σ Stroke and 3σ Stroke. Keep the main reference prominent and use lighter or differently colored bands to organize the view.
These visual changes affect the presentation of the drawing. The starting point, price input and loaded volume data determine its calculation.
Getting started in NinjaTrader 8
- Install the package: in Control Center, choose Tools → Import → NinjaScript Add-On and select the downloaded ZIP. Follow the prompts and restart NinjaTrader if requested.
- Load a chart with price and volume data: include the history containing your intended anchor. Use your connected data feed or recorded Playback data.
- Choose the drawing tool: open the chart’s Drawing Tools menu and select Hameral Order Flow Anchored VWAP. This tool is placed from Drawing Tools, rather than added through the Indicators dialog.
- Click a starting bar: the marker identifies the anchor and the VWAP continues forward from it.
- Review the settings: open Drawing Objects, select the anchored VWAP and check General → Input Price Type. Configure the main Line and the three optional band pairs.
- Reposition when needed: select the anchor marker and drag it to another bar. Recheck the detected price input after moving it.
If nothing appears: confirm that the drawing is visible, its anchor is within the loaded history and at or before the visible chart period, and its line colors contrast with the background. Check that the chart has volume data. This version calculates from chart-bar prices and volumes; it does not require Tick Replay specifically for its VWAP calculation.
Timeframe changes: the anchor is stored by time, while the calculation uses the bars available on the chart. Changing the bar interval can therefore change the result.
License: the 14-day trial starts automatically after installation. Lifetime licenses are generated manually, generally within a few hours.