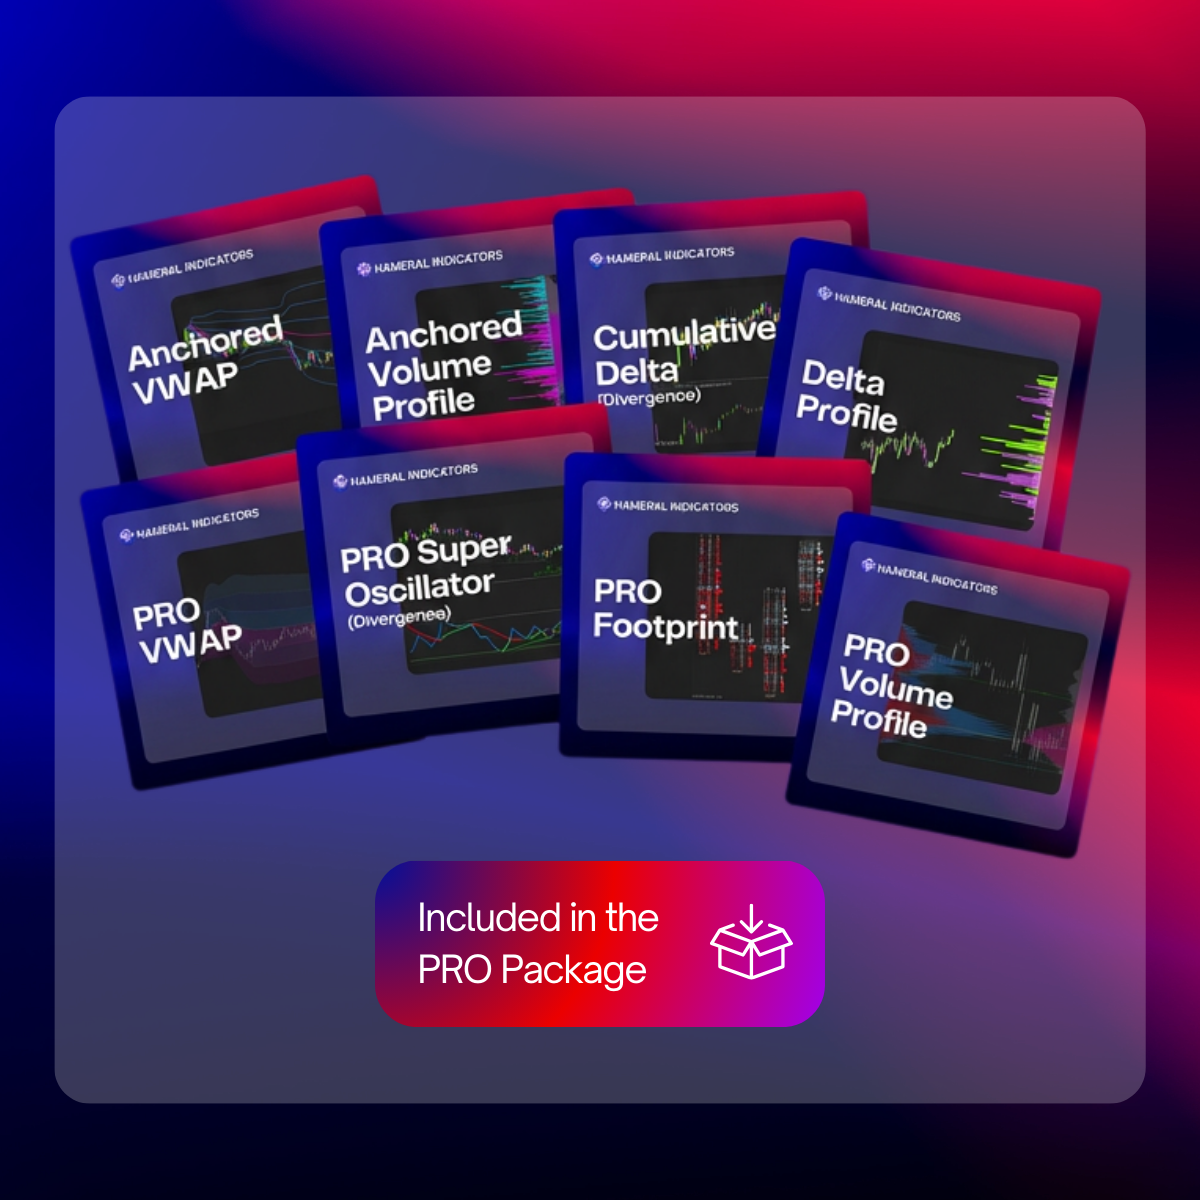
Hameral Order Flow PRO Pack
Pack of core orderflow indicators:
Volume Profile, VWAP, Anchored Volume Profile, Anchored VWAP, Cumulative Delta, Footprint, Delta Profile, Super Oscillator.
![]()
✔️LifeTime License ✔️ Free Updates ✖️ No Order Flow+ Needed
499,00 €
🛡️Secured SLL Checkout
💳 All Major Cards
✖️ VAT Not Included
Included in the Order Flow PRO Pack
Hameral Order Flow Footprint
See buy/sell volume inside each candle, and spot POC, delta, imbalances and absorbtions fast. Includes a complex live data delta table.


Hameral Order Flow Volume Profile PRO
Volume Profile PRO reveals key volume zones like HVN, LVN, VAL, VAH, and POC — across multiple timeframes or custom time ranges.
Hameral Order Flow VWAP PRO
VWAP PRO reveals VWAP and the standard deviations – across multiple timeframes or custom time ranges.


Hameral Cumulative Delta
Cumulative Delta is running total of buy vs. sell volume, used to reveal real market pressure and confirm or anticipate price direction.
Hameral Delta Profile
Delta Profile shows the distribution of buying vs. selling volume at each price level, used to identify hidden imbalances and key reaction zones.


Hameral Anchored Volume Profile
Hameral Anchored Volume Profile maps volume distribution from a specific starting point to reveal key support, resistance, and shift points in market control.
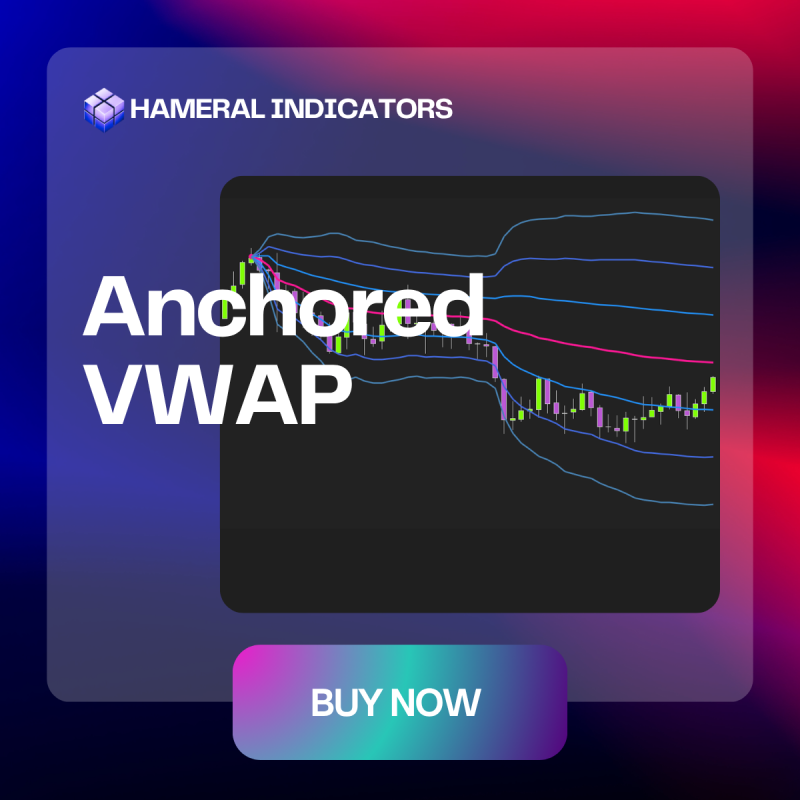
Hameral Anchored VWAP
Hameral Anchored VWAP tracks the true average price from a chosen starting point, showing where real market control and value have been established.


Hameral Super Oscillator PRO
Super Oscillator PRO blends multiple momentum and volatility signals into one tool, giving ultra-clear trend strength, reversals, and exhaustion points.
Examples

Price reached a key level and attempted a breakout. However, at the top, we observed heavy buy orders trying to push the price higher – but with no success.
The Footprint chart plots clear absorption at the highs. Price then closed below the POC, and both the Delta Bar and Delta Change are negative – signaling a potential reversal.