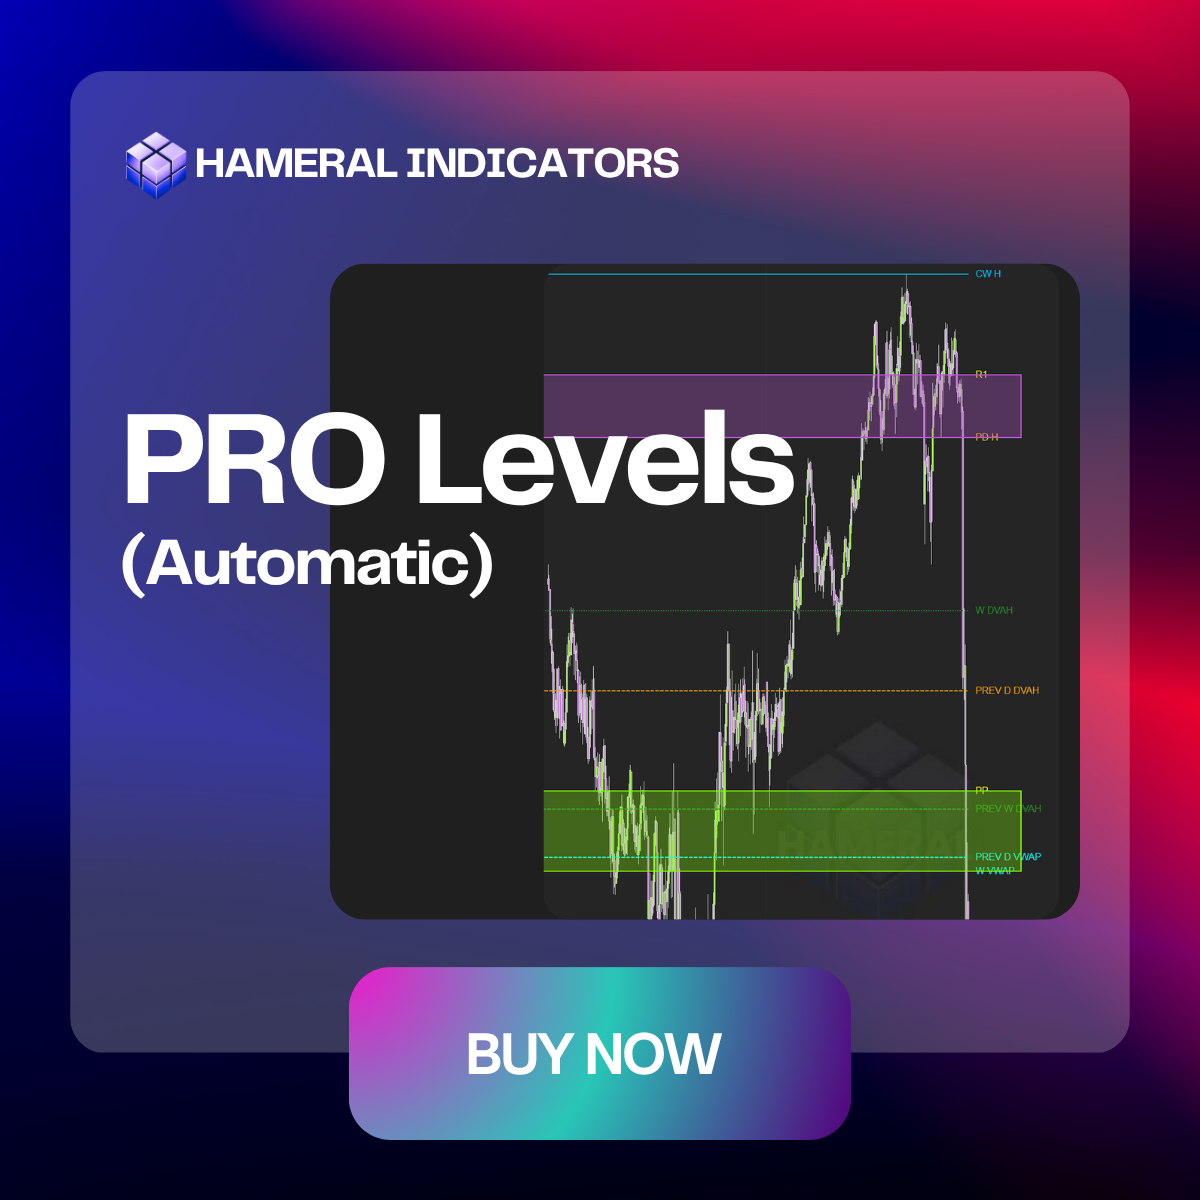
Hameral Levels Pro
Hameral Levels PRO automatically plots previous and current session/day/week/month highs and lows, pivots, and multi-timeframe VWAP levels, then auto-builds confluence zones so you instantly see the most important support and resistance areas without manual drawing.
![]()
✔️LifeTime License ✔️ Free Updates ✖️ No Order Flow+ Needed
149,00 €
🛡️Secured SLL Checkout
💳 All Major Cards
✖️ VAT Not Included
Description
Hameral Levels PRO is built to give you an automatic, always-updated map of the most important price levels on your chart.
Instead of drawing everything by hand, the indicator plots previous and current session/day/week/month highs and lows, pivots and VWAP levels for you in real time.
The real edge comes from its confluence zones: when several key levels overlap or sit very close together, Hameral Levels PRO automatically builds a zone and highlights it on your chart.
These are the places where price is most likely to react, reverse, bounce or break, because multiple pieces of structure line up in the same area.
This helps you quickly see:
- High-probability support and resistance zones without manual drawing.
- Reversal and bounce areas where several important levels align.
- Breakout levels where price needs to win or lose the battle.
- Clean structure so you can focus on execution instead of chart maintenance.
In simple words: Hameral Levels PRO does the level-mapping work for you and shows where the market is most likely to react, so you can make faster and more confident trading decisions.
💡Tip: For even stronger zones, combine Hameral Levels PRO with your Volume Profile’s VAL, VAH and POC areas to spot the highest-probability reaction levels on the chart.
Features & Setups
1. High / Low Levels
This module auto-plots the most important structural highs and lows across multiple timeframes.
These levels act as natural liquidity points where institutions defend price and strong reactions often occur.
What the indicator plots
- Previous Month High/Low – Major swing references for long-term trends and macro structure.
- Previous Week High/Low – Essential for weekly bias, breakouts, and failed-break setups.
- Previous Day High/Low – Classic intraday targets used by professional traders.
- Previous Session High/Low – Helps identify session-based liquidity grabs and rotations.
- Current Overnight High/Low – Key levels where overnight liquidity builds.
- Current Day High/Low – Updates in real time to show the developing intraday range.
- Current Week & Month High/Low – Gives higher-timeframe context as price evolves.
- Pivot Points


2. VWAP Levels
The VWAP module plots multiple VWAP-based levels that help you understand where true average traded price sits across different timeframes.
These levels act as dynamic support and resistance used by institutions, algo models, and volume-based strategies.
What the indicator plots
- Previous Session VWAP – A key benchmark for mean reversion, session trend strength, and liquidity zones.
- Current Session VWAP – Shows the developing fair value for the day as trading unfolds.
- Weekly VWAP – Helps identify trend direction and value areas on a broader timeframe.
- Monthly VWAP – Useful for swing and macro-level positioning, showing long-term average price.
Benefits for the trader
- Dynamic support and resistance that adjust automatically as volume and price evolve.
- Clear fair-value zones where price reverts, reacts, or finds balance.
- Strong confluence potential when VWAP aligns with highs, lows, or pivots.
- No manual work — all VWAP levels update in real time and remain perfectly aligned with your instrument’s session times.
3. Display & Confluence Zones
This section controls how levels appear on your chart and enables the core feature of Hameral Levels PRO:
automatic confluence zones. When multiple important levels sit close together, the indicator
merges them into a single clean zone so you instantly see where strong reactions are likely.
Why Confluence Zones Matter
- Stronger reactions where several levels align.
- Cleaner charts by replacing stacked lines with one zone.
- Instant context for reversals, retests, and breakout points.
Display options let you toggle individual levels, adjust colors and opacity, and control how zones are shaded – making your structure clear and easy to read at a glance.

Examples
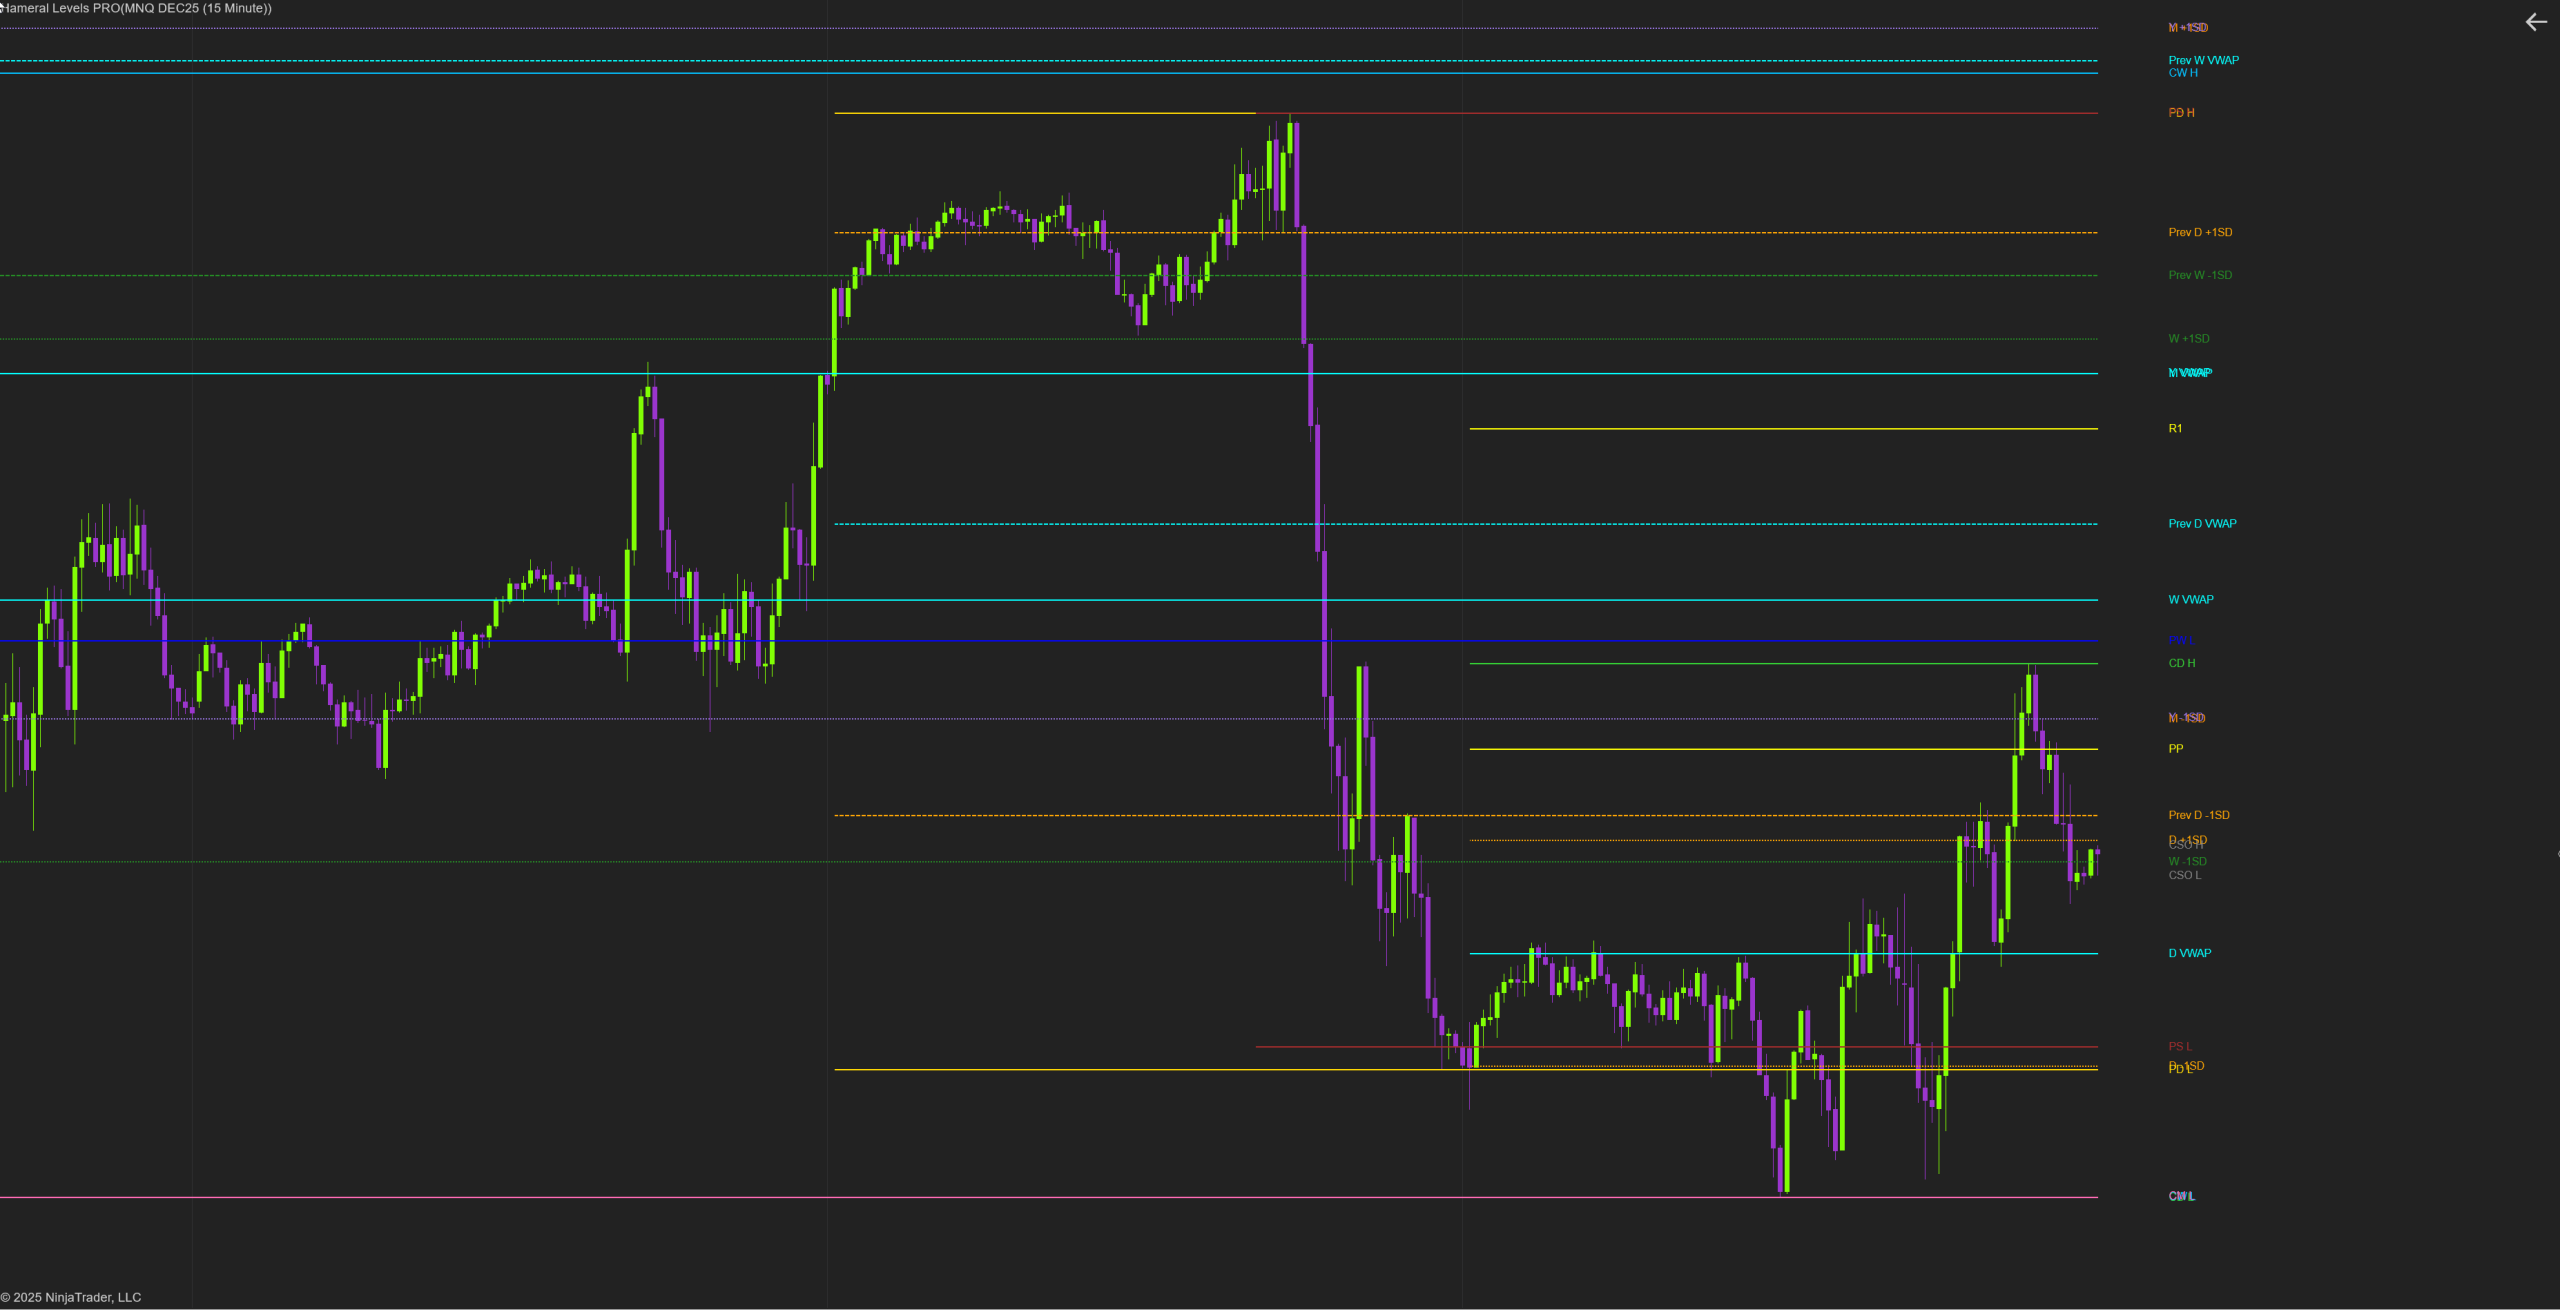
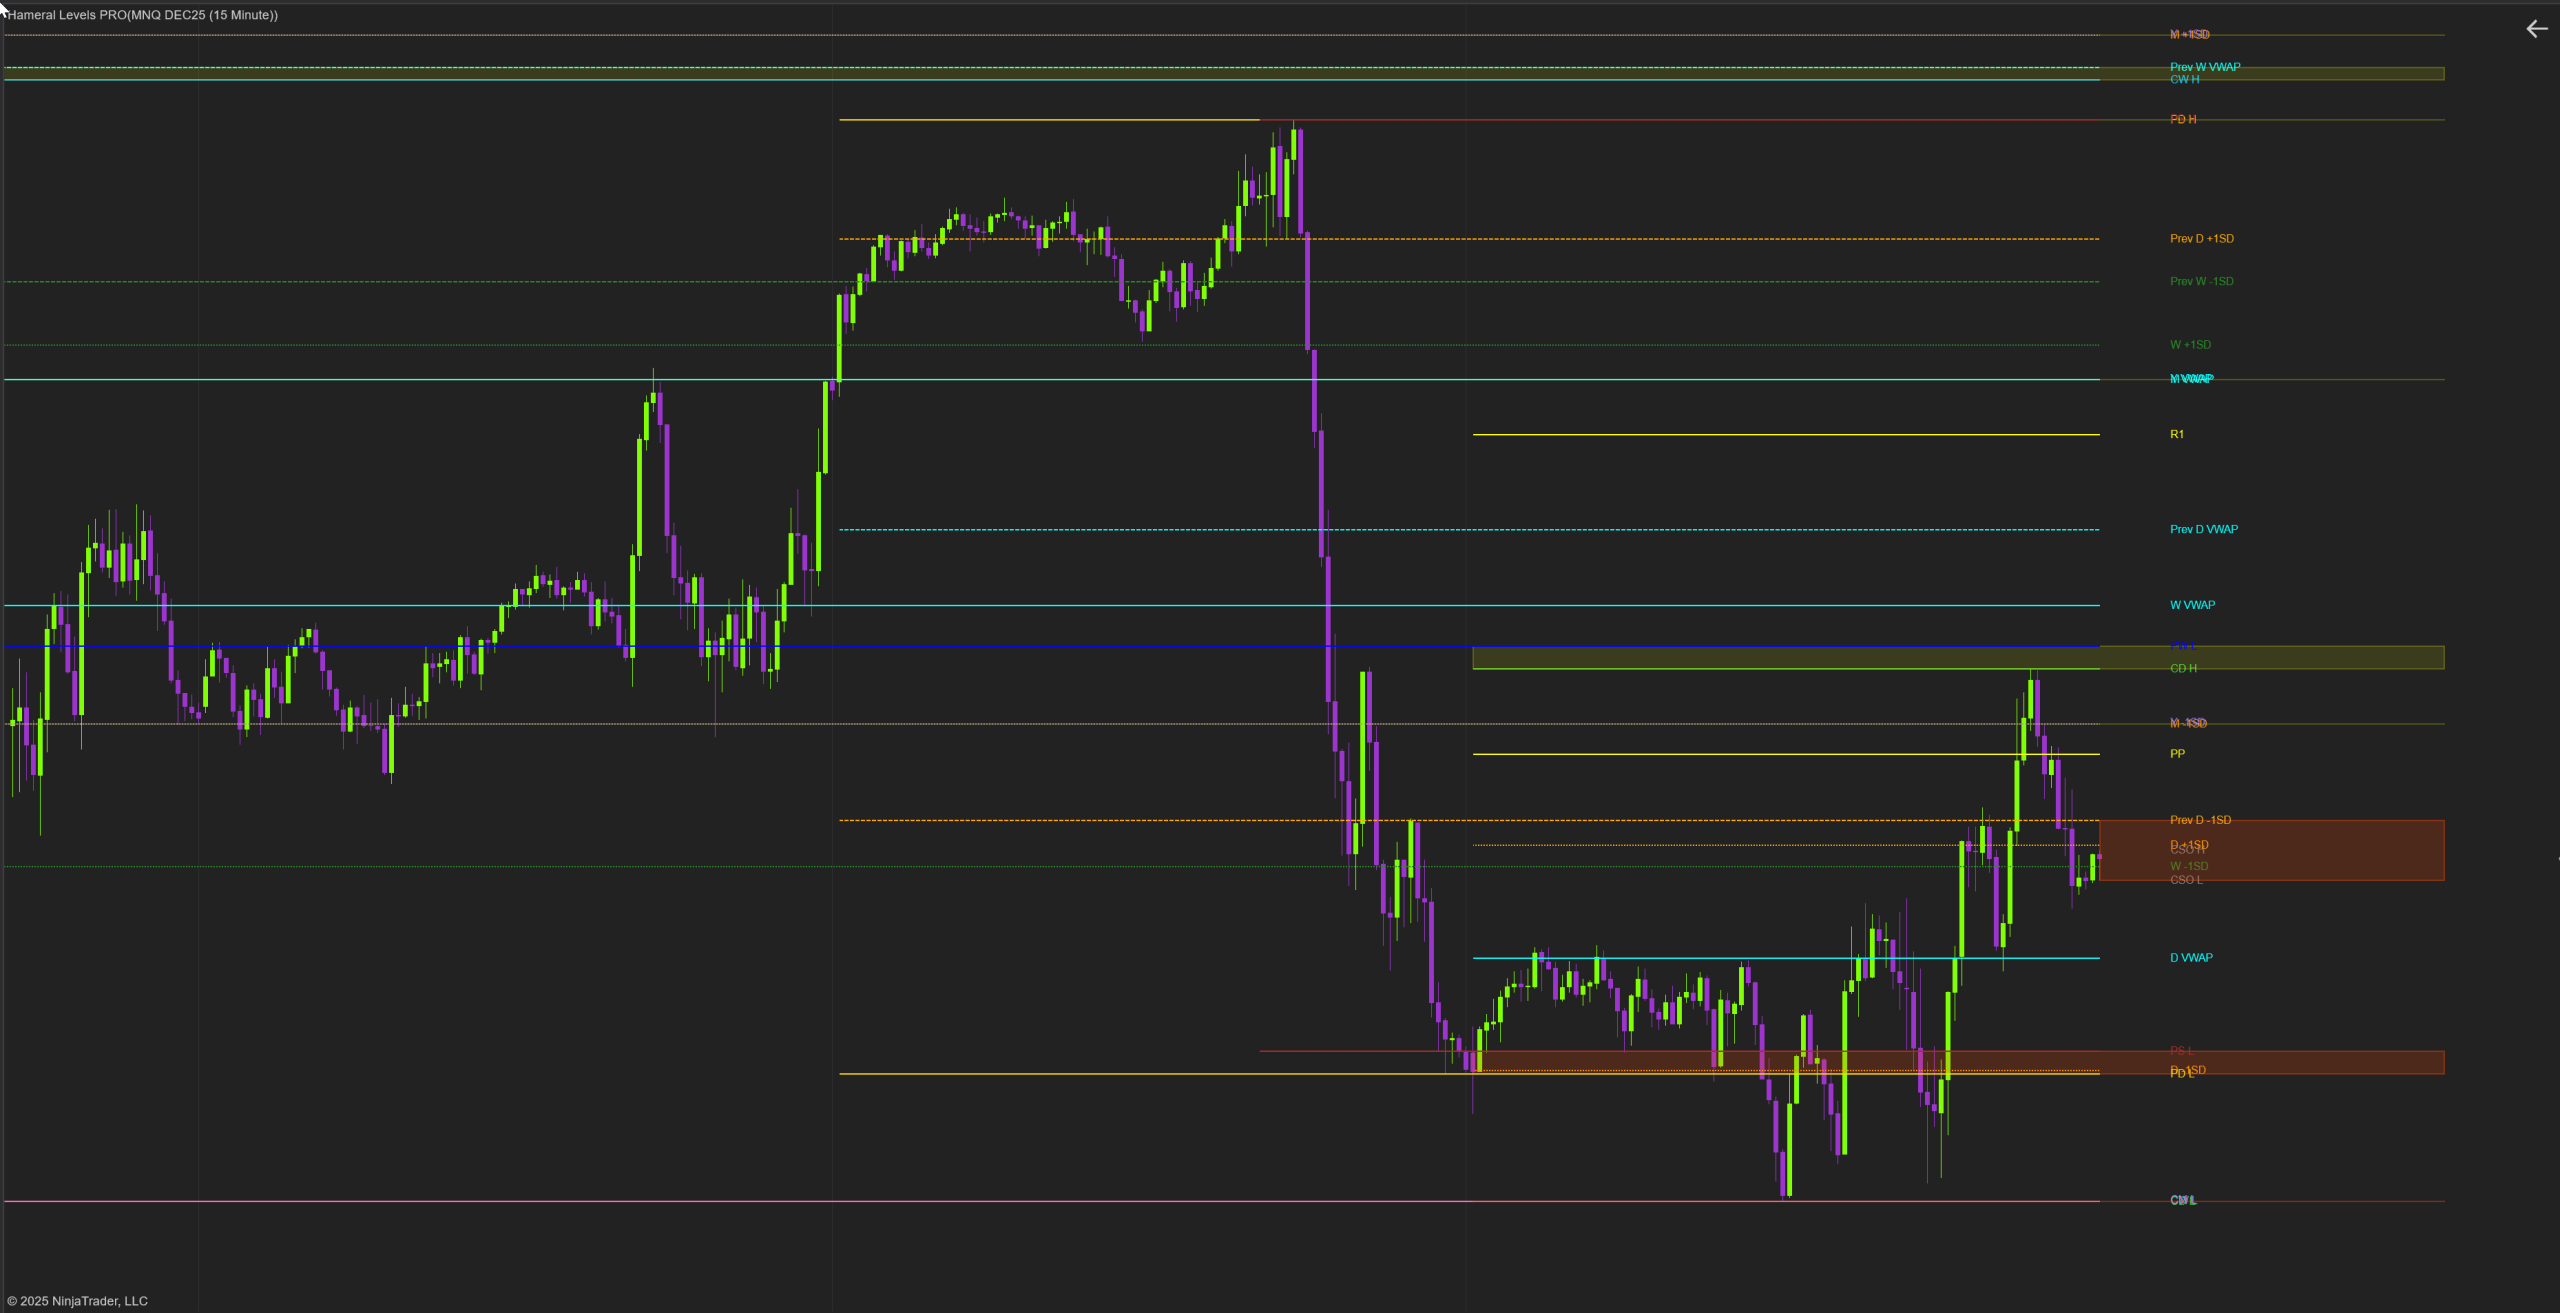
Levels PRO Examples


