
Hameral Order Flow PRO Pack
Pack of core orderflow indicators:
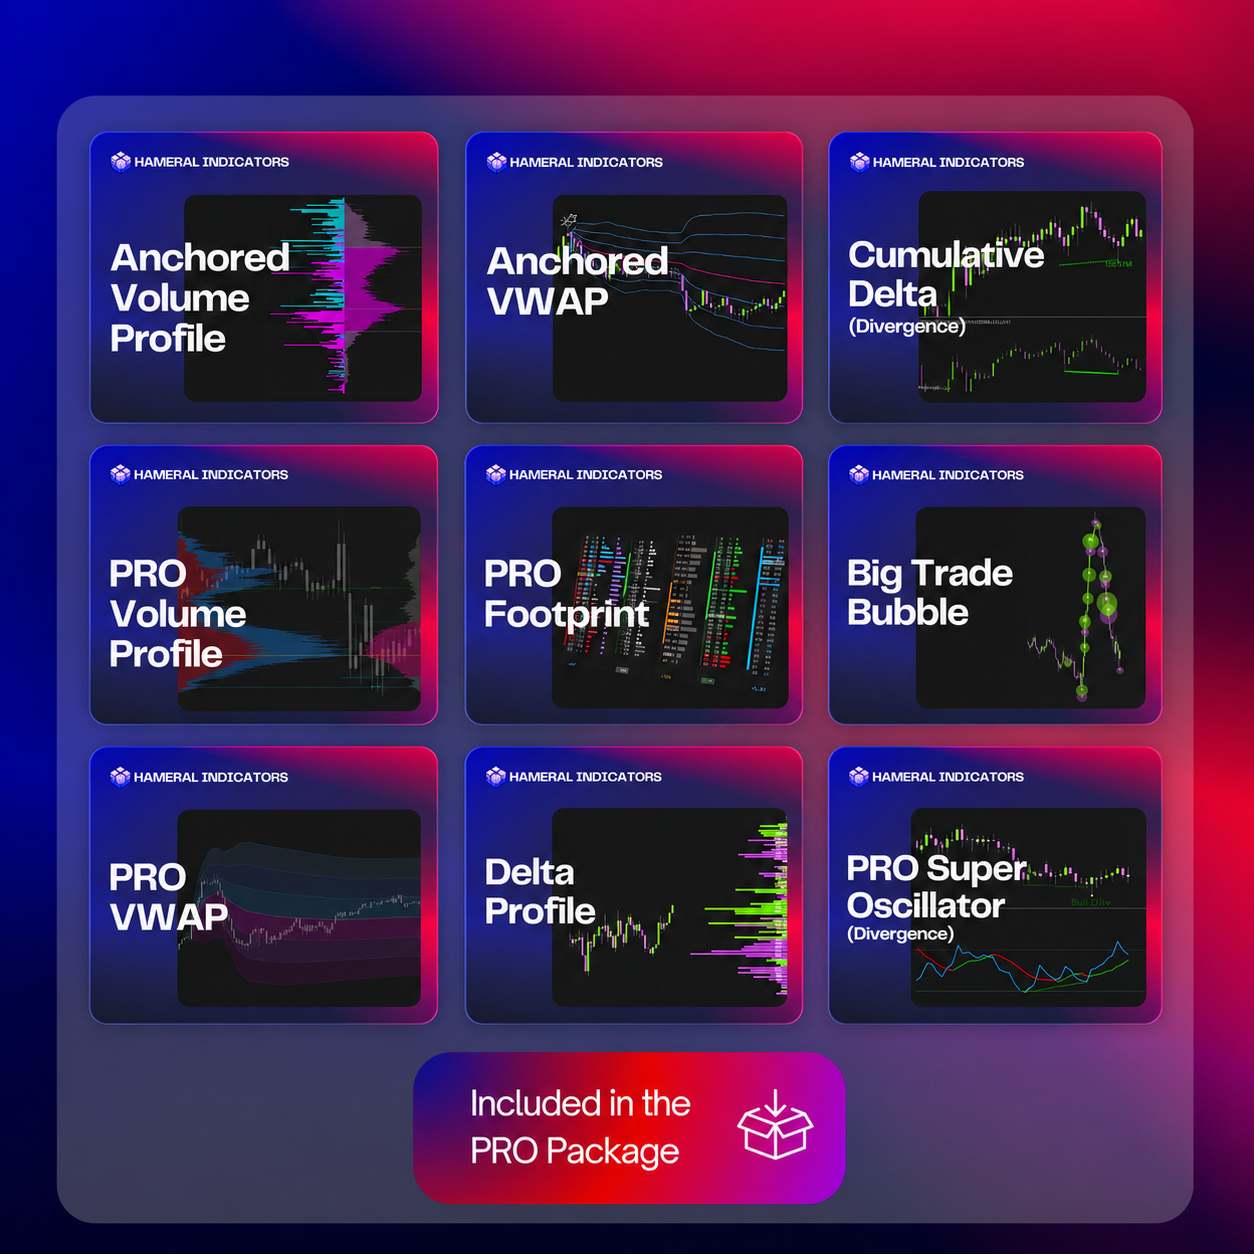
Volume Profile, VWAP, Anchored Volume Profile, Anchored VWAP, Cumulative Delta, Footprint, Delta Profile, Super Oscillator.

✔️LifeTime License ✔️ Free Updates ✖️ No Order Flow+ Needed
🛡️Secured SLL Checkout
💳 All Major Cards
✖️ VAT Not Included
Description
Why Choose the Hameral PRO Pack?
The Hameral Order Flow PRO Pack is a complete toolkit created for traders who want all the essential Order Flow tools in one place.
Complete Order Flow Analysis
From understanding higher timeframe context and identifying key price levels to analyzing traded volume, buyer and seller aggression, delta, and market activity around potential entry areas, the PRO Pack provides the essential Order Flow tools in one integrated ecosystem.
- Optimized Loading Speed – Advanced processing and performance improvements help complex Order Flow charts load faster and run more smoothly.
- Real-Time Control Panels – Adjust important settings directly from the chart without repeatedly opening the NinjaTrader indicator properties.
- Built for Detailed Analysis – Some indicators include more than 100 settings, giving you the flexibility to adapt them to different instruments, workflows, and analysis methods.
- Complete Order Flow Context – Analyze key price areas, traded volume, buyer and seller aggression, delta, large trades, VWAP context, and momentum from one toolkit.
- Modern Design and Technology – Clean interfaces, advanced visualizations, and modern development methods create a more efficient and professional charting experience.
- Lifetime Updates Included – Receive future improvements and access to new indicators added to the PRO Pack at no additional cost.
Included in the Order Flow PRO Pack
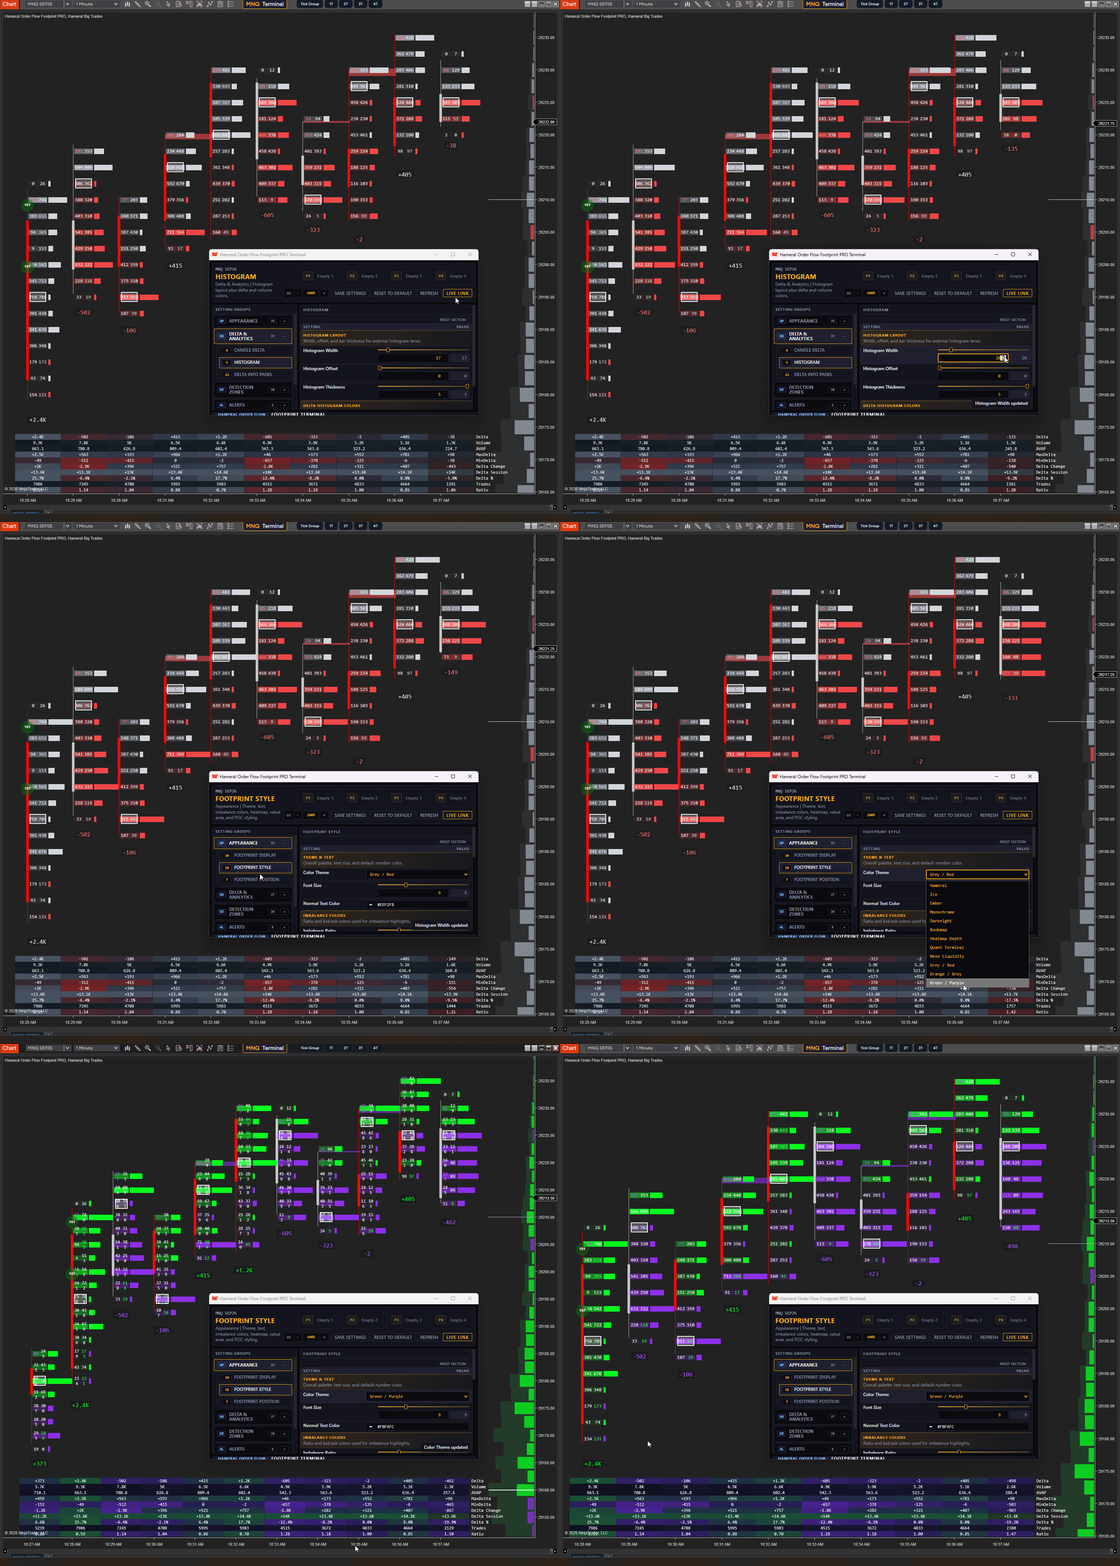
Footprint PRO
Analyze traded volume, buyer and seller aggression, delta, imbalances, and absorption directly inside every candle.
- Real-Time Control Center – Change important Footprint settings directly from the chart and instantly see the result.
- 5 Display Modes – Choose between Bid × Ask, Delta, Volume, Profile Ladder, and other advanced Footprint views.
- Multiple Histograms – Display Volume, Delta, or Delta + Volume histograms below each candle.
- Advanced Candle Features – Show Value Area, POC, Naked POC, Last Trade Price, Total Candle Delta, Total Bid, and Total Ask.
- Price Profile at the Right Side – Display a price profile next to the price scale together with previous-day reference levels.
- Advanced Filters – Hide zero values or display only Volume, Delta, Bid, and Ask values above your custom thresholds.
- Advanced Delta Table – Monitor detailed candle statistics and Order Flow measurements in one organized table.
- Stacked Imbalances & Absorption – Automatically detect and plot stacked imbalances and potential absorption areas.
- Professional Alerts – Receive absorption alerts inside NinjaTrader or through Telegram.
- Premade Templates – Quickly choose from ready-made visual styles and customize them to match your workspace.
and more.
Volume Profile PRO
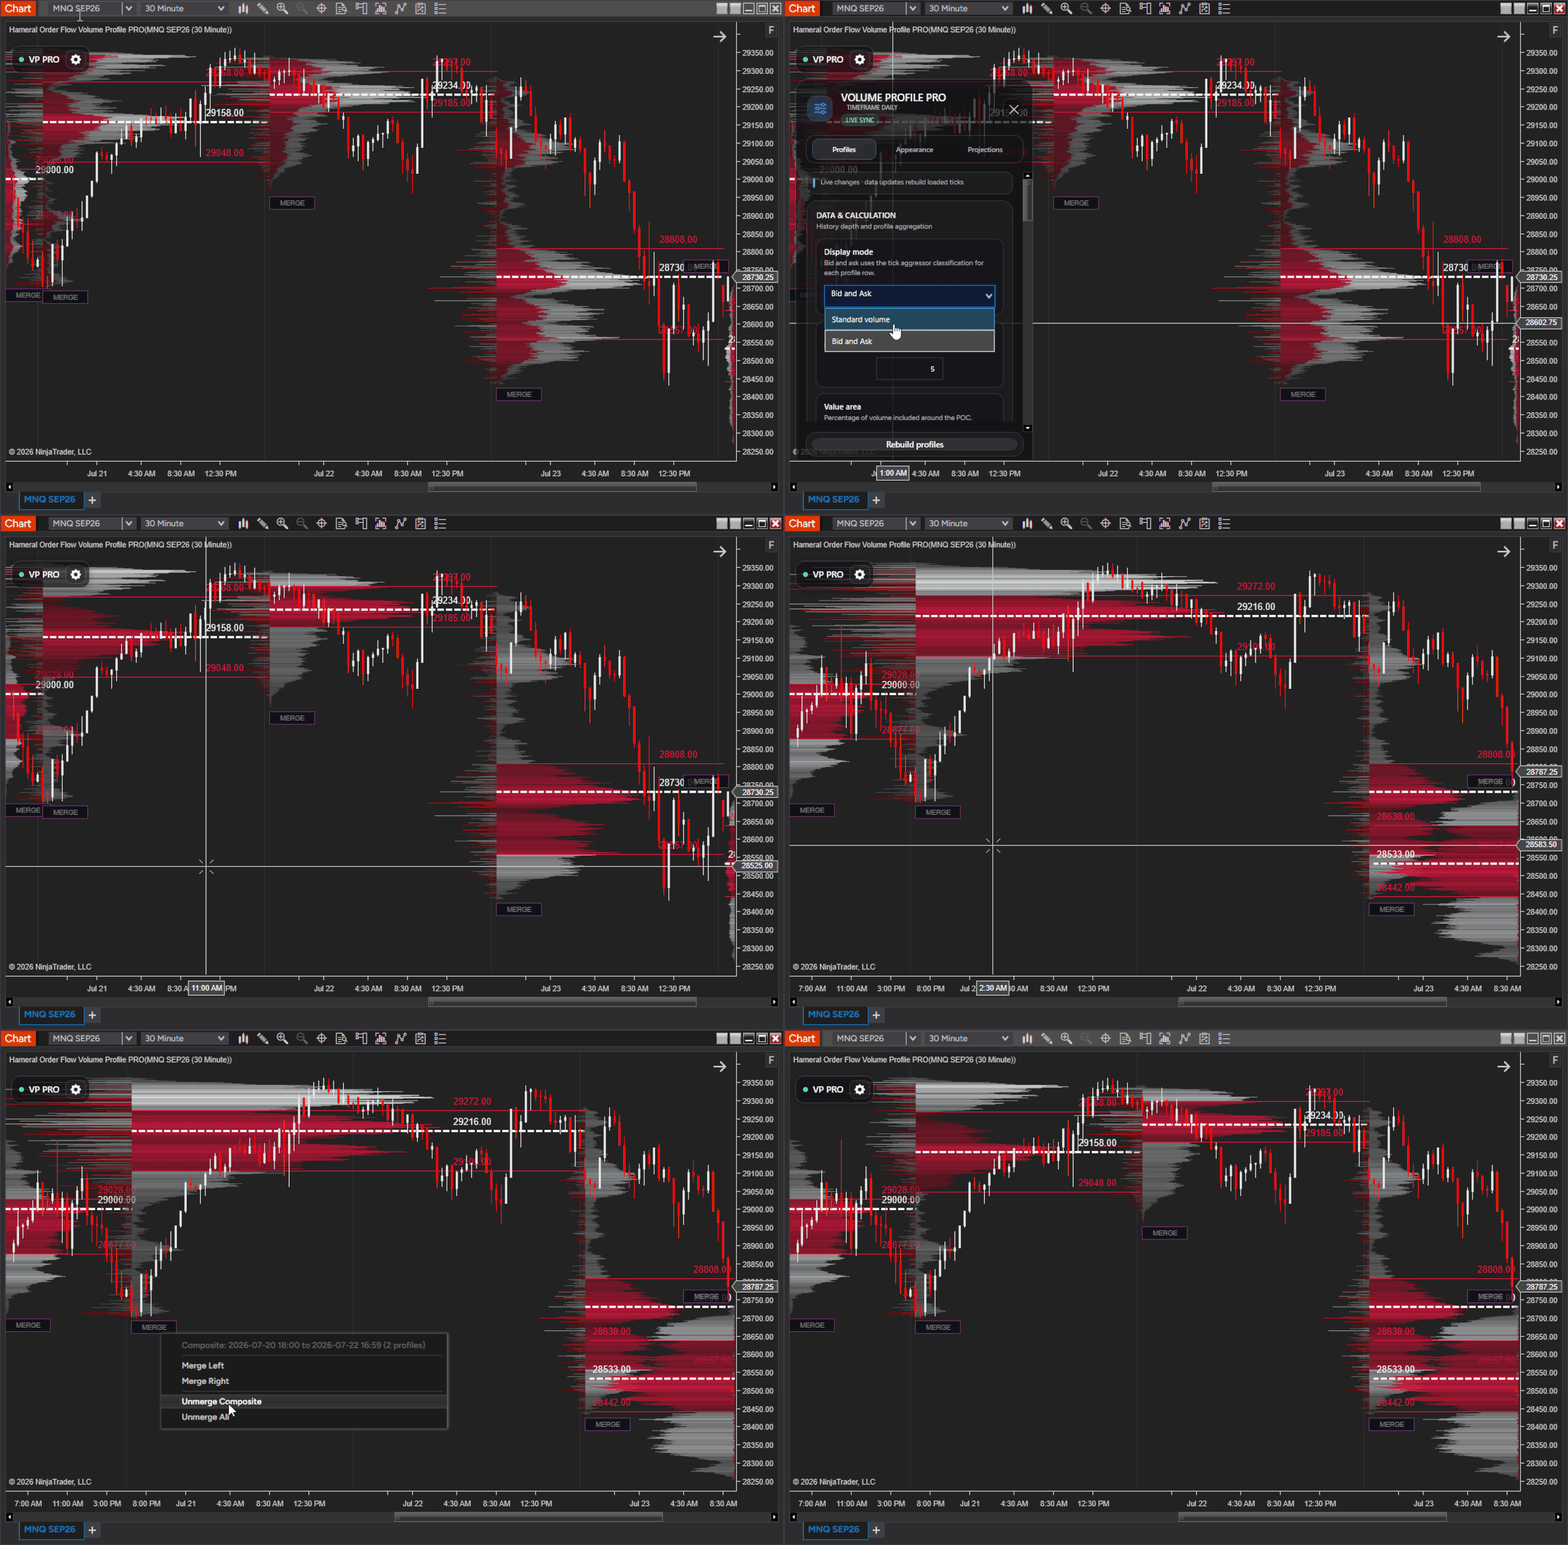
Discover where the market traded the most volume and analyze market structure using one of the most advanced Volume Profile indicators for NinjaTrader.
- Real-Time Control Center – Modify settings instantly from the chart without reloading the indicator.
- Multiple Profile Types – Timeframe Profiles, Custom Sessions, and Custom Time Periods.
- Interactive Profile Merge – Merge any adjacent Volume Profiles directly from the chart.
- Automatic Composite Profiles – Create Composite Profiles using Calendar Periods, Rolling Periods, or Custom Date Ranges.
- Integrated Delta Profile – Display buying and selling pressure alongside the Volume Profile with no Tick Replay required.
- Two Display Modes – Standard Volume Profile or Bid × Ask Profile.
- Active Profile at Price Scale – Keep the current profile visible without covering price action.
- Complete Appearance Customization – Gradient or flat colors, histogram width, opacity, profile position, colors, labels, and more.
- Historical Level Projections – Extend previous POCs, VAHs, and VALs with fully customizable styles.
- Optimized Performance – Advanced historical cache dramatically reduces loading time for Weekly and Monthly Volume Profiles.
VWAP PRO
Analyze market direction and price location with a fully customizable Multi-Timeframe VWAP designed for professional Order Flow traders.
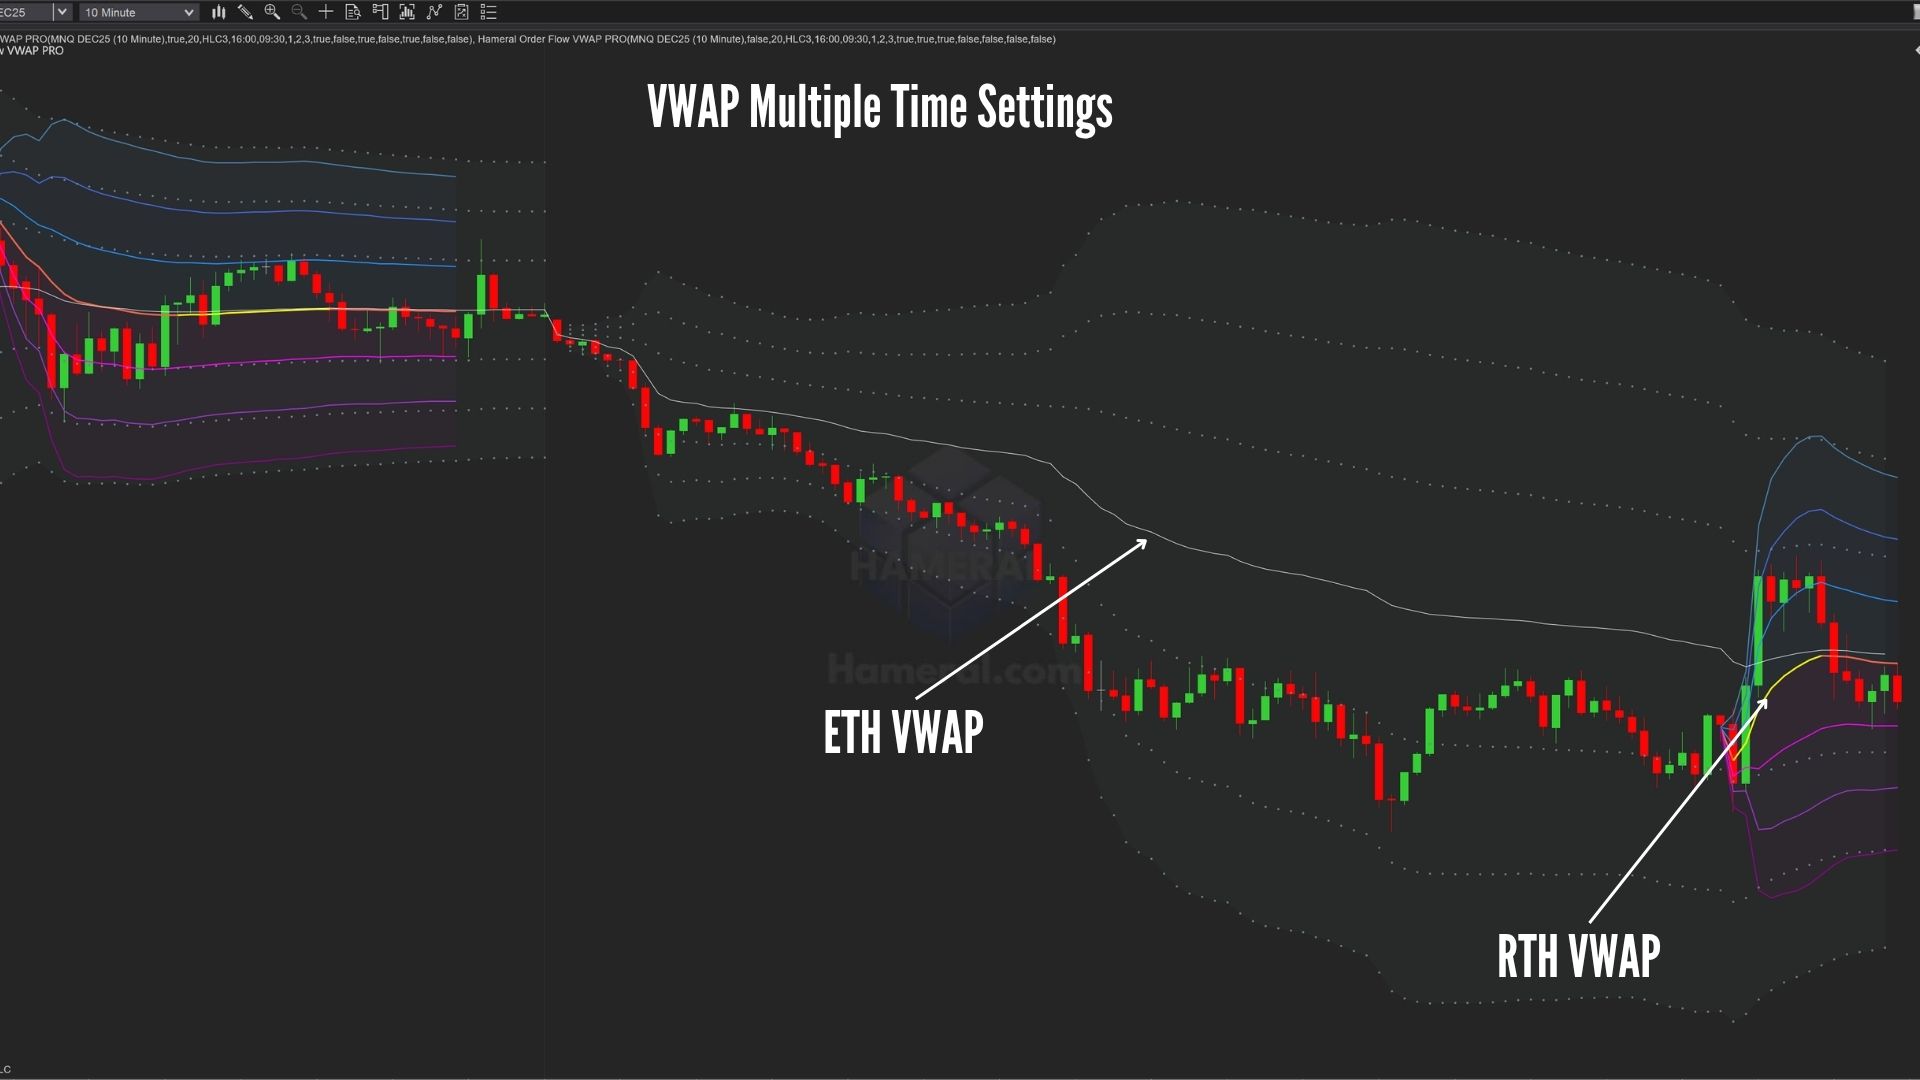
- Multiple Timeframe VWAPs – Display Daily, Weekly, Monthly, or custom VWAPs simultaneously on the same chart.
- Standard Deviation Bands – Display up to multiple deviation bands to better visualize price movement around the VWAP.
- Custom Trading Sessions – Calculate VWAP using RTH, ETH, or your own custom trading sessions.
- Independent VWAP Instances – Add multiple VWAPs to the same chart with completely independent settings.
- Complete Appearance Customization – Customize colors, line styles, labels, opacity, and every Standard Deviation band independently.
- Optimized Performance – Designed for smooth real-time calculations with minimal impact on chart performance.

Cumulative Delta PRO
Visualize the cumulative buying and selling pressure behind every market move while automatically detecting regular and hidden divergences.
- Flexible Delta Calculation – Reset the Cumulative Delta at the beginning of each trading session or calculate it continuously from the beginning of the chart.
- Zero Line Display – Display the zero reference line to quickly identify when cumulative buying or selling pressure changes direction.
- Automatic Divergence Detection – Automatically identify and plot regular and hidden bullish or bearish divergences based on your preferred settings.
- Provisional Divergences – Display potential divergences before they are confirmed, allowing you to monitor developing market conditions in real time.
- Fully Customizable Appearance – Customize candle colors, divergence colors, zero line, level marker, text, arrows, line styles, and many other visual settings.
- Speed Optimized – Optimized historical calculations and optional current-session processing provide faster loading and improved performance on large datasets.
Delta Profile
Analyze net buying and selling pressure at each price level using flexible Delta Profiles built around the exact period you want to study.
- Custom Time Delta Profiles – Create profiles using a specific timeframe, a custom session with your selected start and end times, or a custom interval such as 45 minutes.
- Leg-to-Leg Delta Profile – Select the start and end points directly on the chart to calculate delta for a specific market move or swing.
- Adjustable Tick Grouping – Group multiple price levels together to reduce noise, simplify the profile, and see the broader picture more clearly.
- Multiple Display Styles – Position the profile on the right or left side and display positive and negative delta on the same side or on opposite sides.
- Complete Appearance Customization – Customize profile width, offset, colors, text, font size, borders, and other visual elements.
- Real-Time Calculation – Follow buying and selling pressure as the Delta Profile updates continuously with new market activity.
- Speed Optimized – Designed for efficient processing and smooth real-time performance during active trading sessions.


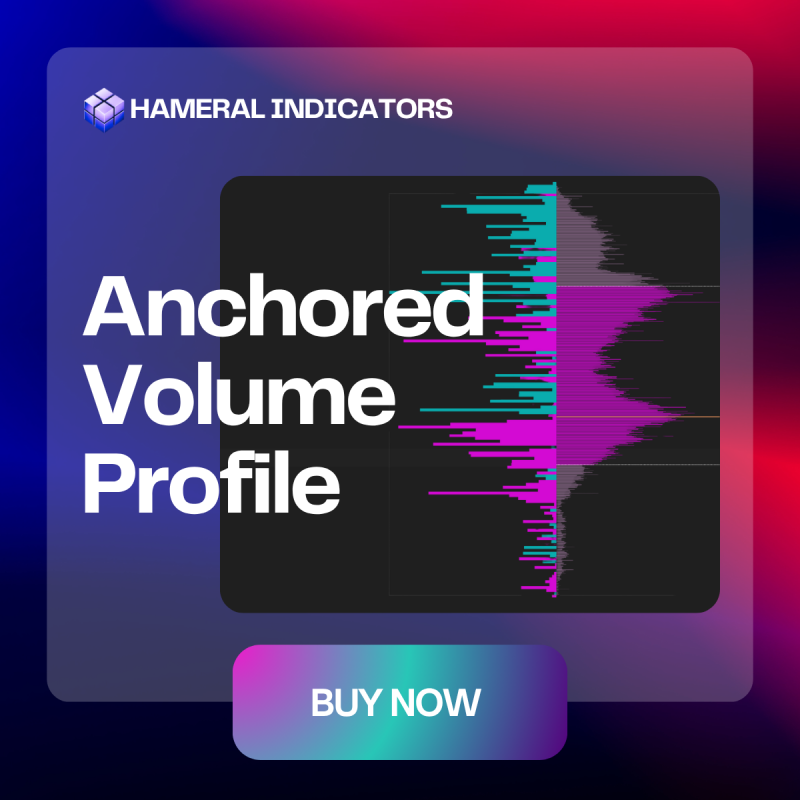
Anchored Volume Profile
Analyze volume distribution from any market move by creating fully interactive Volume Profiles exactly where you need them.
- Interval Anchoring – Click the start and end points to instantly create a Volume Profile for any custom price range.
- Dynamic Anchoring – Anchor the profile at any starting point and let it automatically extend to the current price, updating live tick by tick as new market data arrives.
- 4 Profile Display Styles – Choose between Standard Volume, Delta, Bid × Ask, or Combined Volume + Delta profiles.
- Extend Key Levels – Project POC, VAH, and VAL until the current price to keep important historical volume levels visible even after the original profile is no longer on the chart.
- Fast Interactive Workflow – Create, move, resize, or remove profiles quickly without interrupting your chart analysis.
Anchored VWAP
Create interactive VWAPs from any important market event and follow how the average traded price evolves in real time.
- Interactive Anchoring – Simply click any candle to place the starting point of the Anchored VWAP and begin analyzing price from that moment.
- Live Dynamic Calculation – The VWAP automatically extends to the current candle and updates continuously as new market data arrives.
- 3 Input Price Modes – Calculate the VWAP using the High, Low, or Median price of each candle.
- Up to 3 Standard Deviation Bands – Display independent ±1σ, ±2σ, and ±3σ bands with fully customizable multipliers, colors, and line styles.
- Fully Customizable Appearance – Customize the VWAP line together with every Standard Deviation band independently.
- Interactive Editing – Move the anchor at any time to instantly recalculate the entire VWAP from a new market event.
- Fast Interactive Workflow – Create, reposition, or remove Anchored VWAPs quickly without interrupting your chart analysis.
- Optimized Performance – Efficient calculations and real-time rendering provide smooth interaction even while the VWAP updates live.


Super Oscillator PRO
Combine five major momentum indicators into one streamlined oscillator designed to reduce noise and simplify overbought, oversold, momentum, and divergence analysis.
- 5 Indicators in One Formula – Combines RSI, TDI, Williams %R, Money Flow Index, and Stochastics into one unified oscillator.
- Custom Overbought & Oversold Levels – Define your preferred threshold levels and quickly identify extended market conditions.
- Momentum Moving Average – Display a moving average of the oscillator with dynamic colors that indicate whether momentum is strengthening or weakening.
- Automatic Dots – Plot visual dots on the main chart when the oscillator turns from an extreme area and price confirms the move with a strong rejection candle.
- Automatic Divergence Detection – Detect and plot regular and hidden bullish or bearish divergences based on your preferred settings.
- Provisional Divergences – Display developing divergences before the second pivot is fully confirmed, with optional live updates and expiry controls.
- Divergences on Price & Oscillator – Display divergence lines on the main price chart, the oscillator panel, or both.
- Optional Bollinger Bands – Add fully adjustable Bollinger Bands around the oscillator to analyze relative momentum expansion and contraction.
- Advanced Divergence Filters – Adjust pivot strength, maximum bars between pivots, price tolerance, oscillator tolerance, and provisional swing settings.
- Complete Appearance Customization – Customize signal dots, levels, divergence lines, arrows, text, colors, line width, offsets, and Bollinger Band settings.
Big Trade Bubble
Highlight large market activity directly on your chart and quickly identify where significant buying or selling volume appears.
- 4 Detection Modes – Choose between Sweep, Aggressive Bid/Ask, Level Volume, and Big Print calculations.
- Sweep Detection – Group fast, same-side trades into a single bubble using a customizable time window, volume threshold, price range, and retracement tolerance.
- Aggressive Bid & Ask Detection – Aggregate aggressive buying and selling activity while bid and ask prices remain at the same levels.
- Level Volume Detection – Calculate the combined buying and selling volume traded at each price level and display a bubble when your selected threshold is reached.
- Big Print Detection – Instantly plot individual trades that exceed your custom volume threshold.
- Advanced Sweep Filters – Filter activity using minimum aggression, sweep distance, DOM pressure, same-side support, market-at-best volume, estimated icebergs, and smart liquidity depletion.
- Flexible Aggressor Calculation – Classify activity using Bid × Ask data, Up/Down Tick logic, or a combined calculation method.
- Volume-Based Bubble Sizing – Automatically scale bubble size according to total volume or aggressive market volume.
- Detailed Bubble Information – Display volume labels and optional details such as buy volume, sell volume, aggression, DOM pressure, support, and estimated iceberg activity.
- Complete Appearance Customization – Customize bubble colors, size range, opacity, borders, labels, text, placement, and the maximum number of bubbles displayed.
- Real-Time Processing – Detect and plot large trades continuously as new market data arrives.

Examples

Price reached a key level and attempted a breakout. However, at the top, we observed heavy buy orders trying to push the price higher – but with no success.
The Footprint chart plots clear absorption at the highs. Price then closed below the POC, and both the Delta Bar and Delta Change are negative – signaling a potential reversal.



Empowering retail traders with institutional-grade indicators. Trade smarter, not harder with our professional NinjaTrader® tools.


“NinjaTrader® is a registered trademark of NinjaTrader Group, LLC. No NinjaTrader company has any affiliation with the owner, developer, or provider of the products or services described herein, or any interest, ownership or otherwise, in any such product or service, or endorses, recommends or approves any such product or service.
Risk Disclosure:
Futures and forex trading contains substantial risk and is not for every investor. An investor could potentially lose all or more than the initial investment. Risk capital is money that can be lost without jeopardizing ones’ financial security or life style. Only risk capital should be used for trading and only those with sufficient risk capital should consider trading. Past performance is not necessarily indicative of future results.
Hypothetical Performance Disclosure:
Hypothetical performance results have many inherent limitations, some of which are described below. No representation is being made that any account will or is likely to achieve profits or losses similar to those shown; in fact, there are frequently sharp differences between hypothetical performance results and the actual results subsequently achieved by any particular trading program. One of the limitations of hypothetical performance results is that they are generally prepared with the benefit of hindsight. In addition, hypothetical trading does not involve financial risk, and no hypothetical trading record can completely account for the impact of financial risk of actual trading. For example, the ability to withstand losses or to adhere to a particular trading program in spite of trading losses are material points which
can also adversely affect actual trading results. There are numerous other factors related to the markets in general or to the implementation of any specific trading program which cannot be fully accounted for in the preparation of hypothetical performance results and all which can adversely affect trading results.
Testimonials:
Testimonials appearing on this website may not be representative of other clients or customers and is not a guarantee of future performance or success.
Live Trade Room or Trade Examples/ Ideas:
This presentation is for educational purposes only and the opinions expressed are those of the presenter only. All trades presented should be considered hypothetical and should not be expected to be replicated in a live trading account.
Affiliate Disclosure:
Some links on this website may be affiliate links. Hameral may receive compensation if you register or sign up through our links, at no additional cost to you.
Hameral does not recommend, endorse, or advise users to use any specific broker, brokerage service, deposit method, funding provider, or place to deposit money. Any decision to open, fund, or use a brokerage account is made solely by the user and is subject to the third-party provider’s own terms, conditions, risk disclosures, and regulatory obligations.
Our references to NinjaTrader are related to platform access, charting, market analysis, simulation, and compatibility with the tools and indicators developed by Hameral. Our tools are built to work with the NinjaTrader platform and are provided for educational and analytical purposes only.
Hameral is not a broker, financial advisor, investment firm, portfolio manager, or trading signal provider. We do not provide brokerage services, investment advice, personalized recommendations, account management, order execution, or trade signals.
You are solely responsible for how you use our tools, how you interpret any market information, and how you manage your own money, risk, trading decisions, and financial accounts. Trading financial instruments involves substantial risk and may result in the loss of some or all of your capital.