Hameral Anchored Volume Profile
Hameral Anchored Volume Profile maps volume distribution from a specific starting point to reveal key support, resistance, and shift points in market control.


✔️LifeTime License ✔️ Free Updates ✖️ No Order Flow+ Needed
🛡️Secured SLL Checkout
💳 All Major Cards
✖️ VAT Not Included
Description
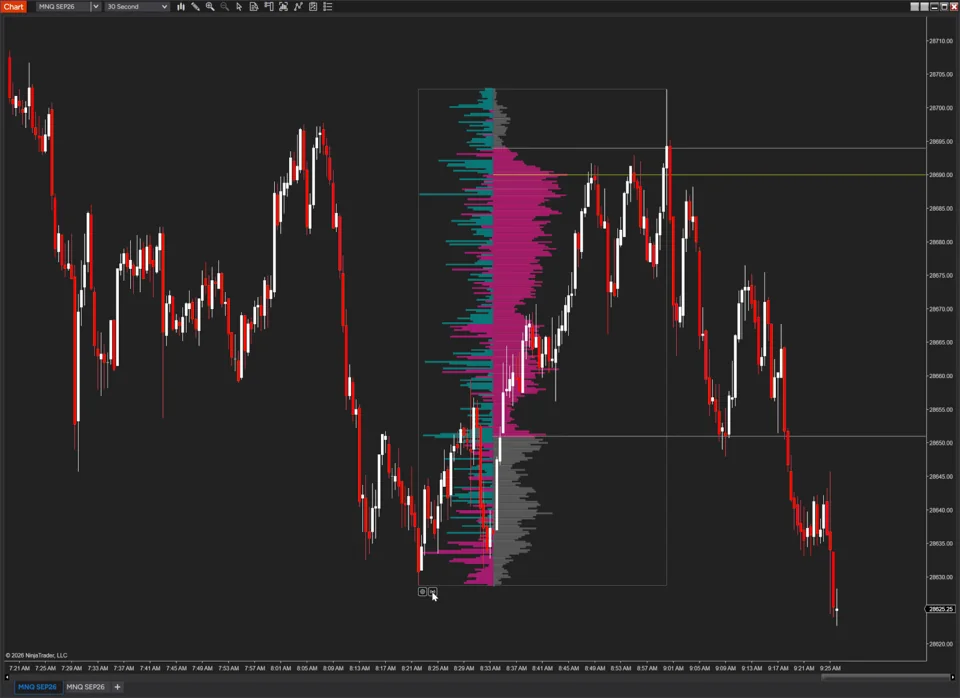
Choose the move. See where its volume traded. Hameral Anchored Volume Profile lets you select a start and end point on your NinjaTrader 8 chart and build a volume profile for that specific range. Study a swing, a consolidation or an event-driven move without being restricted to a whole session.
See total volume, buying and selling activity, or delta at each price. Use the point of control (POC) and value-area boundaries to add context to areas you want to monitor, then keep those reference levels visible as price moves forward.
Keep a selection fixed for historical analysis, or let it grow to the latest bar with tick-by-tick updates. Four display modes, a reversible profile and adjustable width, value area and colors help you fit the analysis into your own chart layout.
Features & Setup
Choose your own start and end point
Analyze the range that matters to your question. Draw the profile between two points on your chart, then move its anchors to refine the selected period. The profile follows the selected bars and their price range.
Isolate a trend leg, compare a consolidation with its breakout, or study the activity around a specific event. Your range is independent of a predefined daily or weekly session.
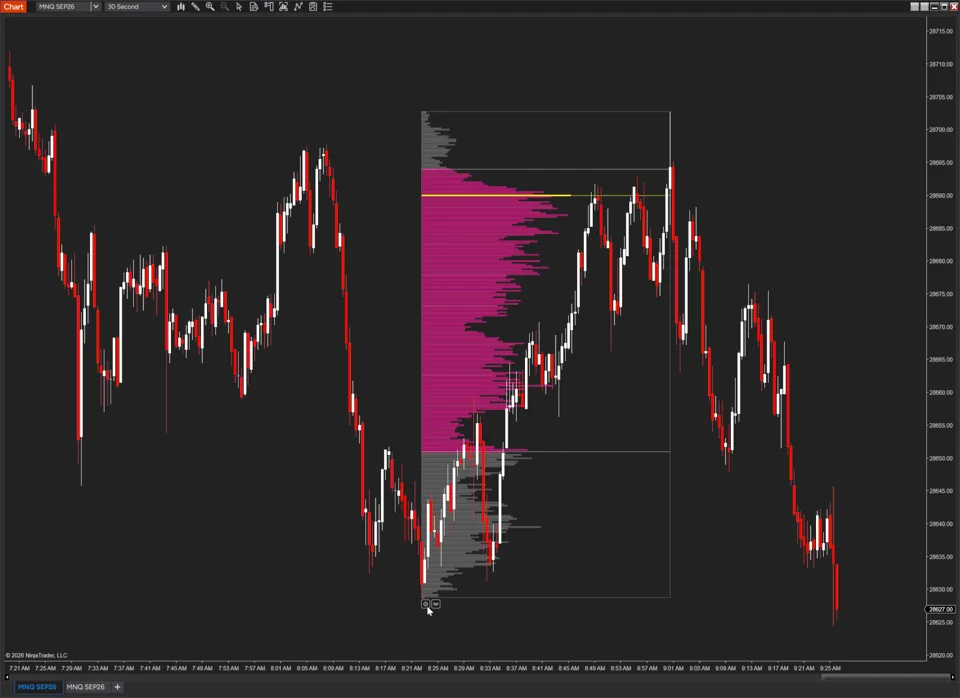
Four ways to read the same volume
Switch Display Mode to match what you want to examine:
- Standard: total traded volume at each price, with the value area highlighted.
- Bid & Ask (BuySell): separate buying and selling volume to compare participation.
- Delta: the difference between buying and selling volume at each price.
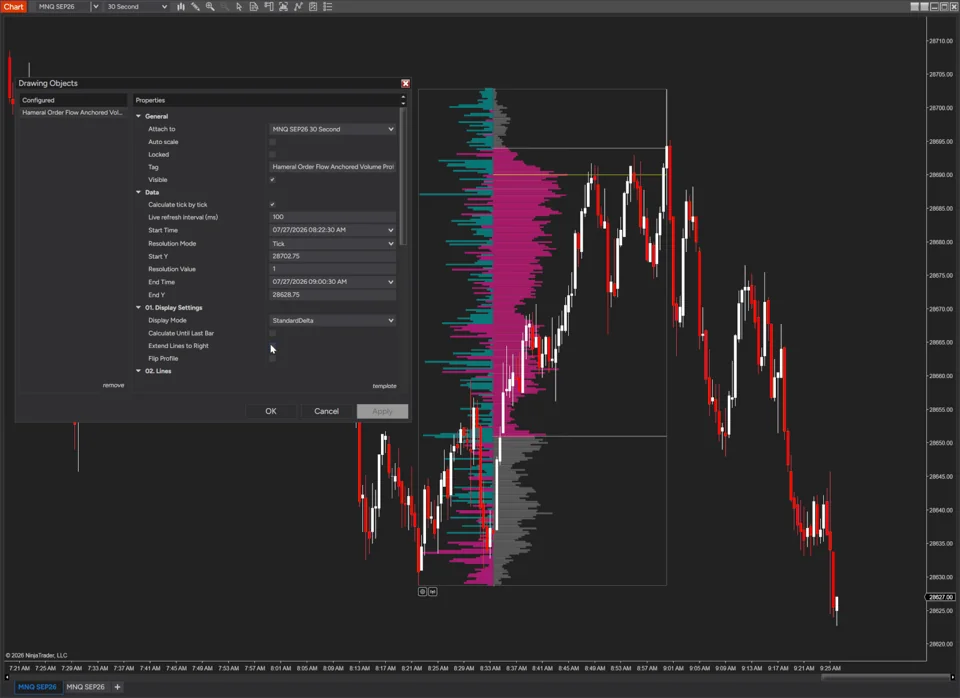
- Standard & Delta (StandardDelta): total-volume structure and a delta panel in one profile.
The combined view also has controls for delta-panel width, scaling, intensity and tick grouping.
Bring historical levels into the present
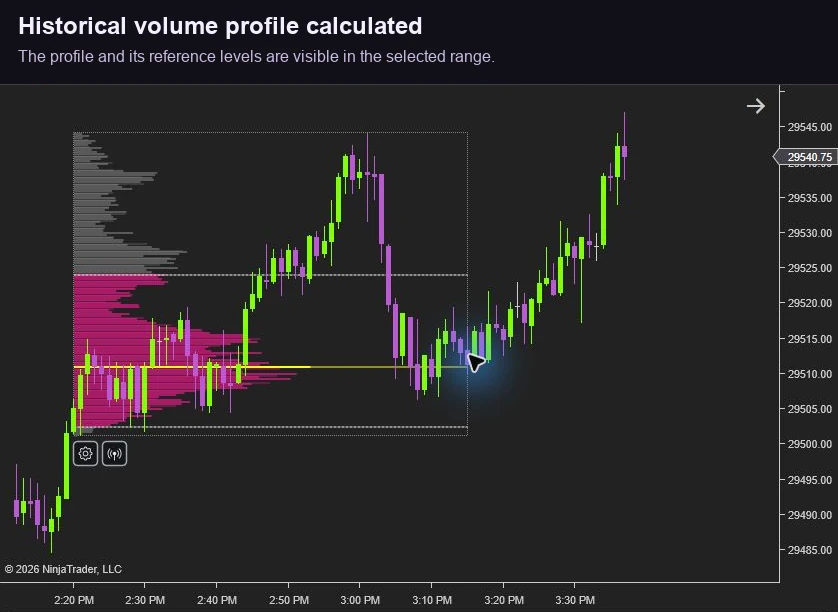
Enable Extend Lines to Right to carry the selected profile’s POC and value-area boundaries across to the right edge of the chart. Keep the relevant line options enabled under 02. Lines.
This is useful when the original selected range has scrolled off-screen: its reference levels can remain visible alongside current price. The setting extends the lines of a fixed selection; it does not add later bars to that profile’s calculation.
Let the profile grow to the latest bar
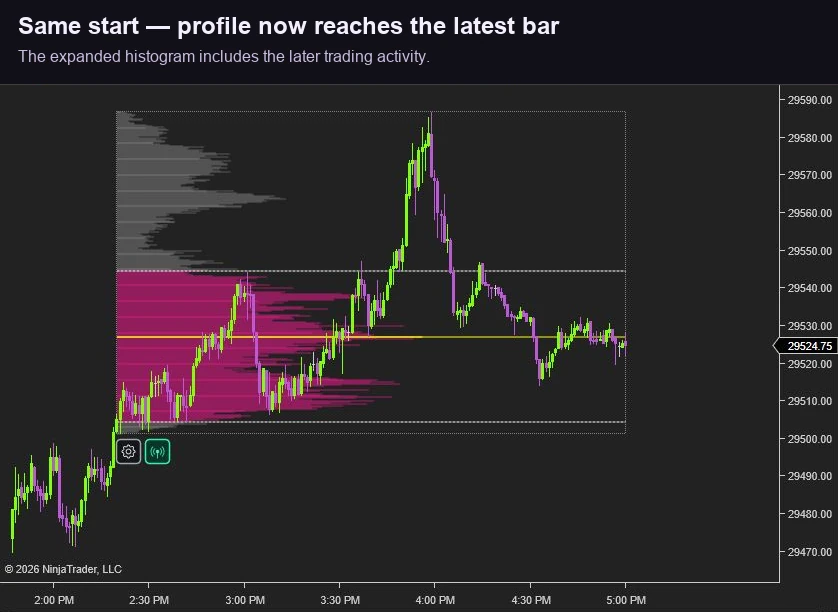
Turn on Calculate Until Last Bar to keep your starting anchor and extend the calculation through the latest chart bar. Enable Calculate tick by tick for live updates as new trade data arrives.
The tool builds its profile from one-tick trade data. The Live refresh interval (ms) controls how often the visual refreshes; every processed trade is still included. The on-chart live shortcut switches the growing calculation on or off.
A fixed selection and a growing live range serve different purposes. Extend Lines to Right applies to the fixed-range view; use Calculate Until Last Bar when you want the volume calculation itself to continue.
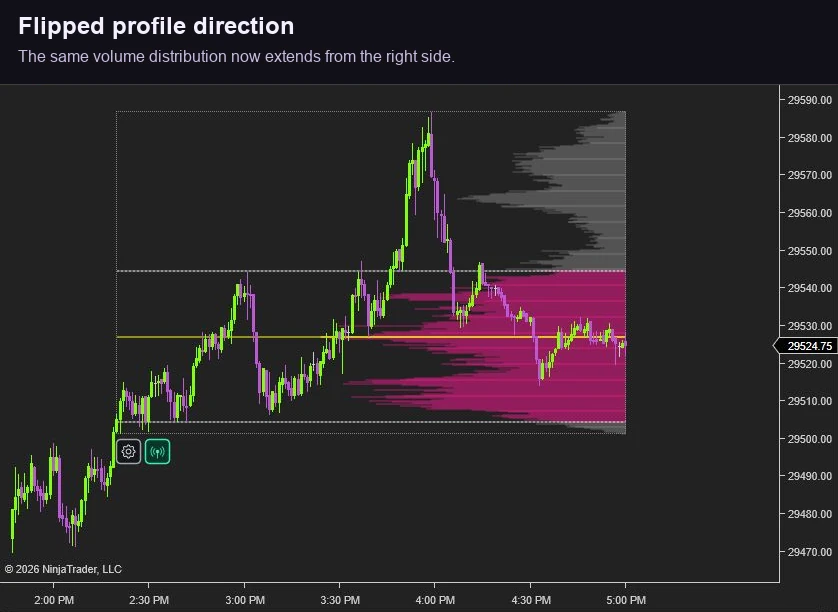
Flip the profile to fit your chart
Use Flip Profile to reverse the histogram’s direction within the selected range. Keep the display convenient for the candles and levels you are studying.
Flipping changes the layout of the profile, while preserving the selected period and its calculated volume.
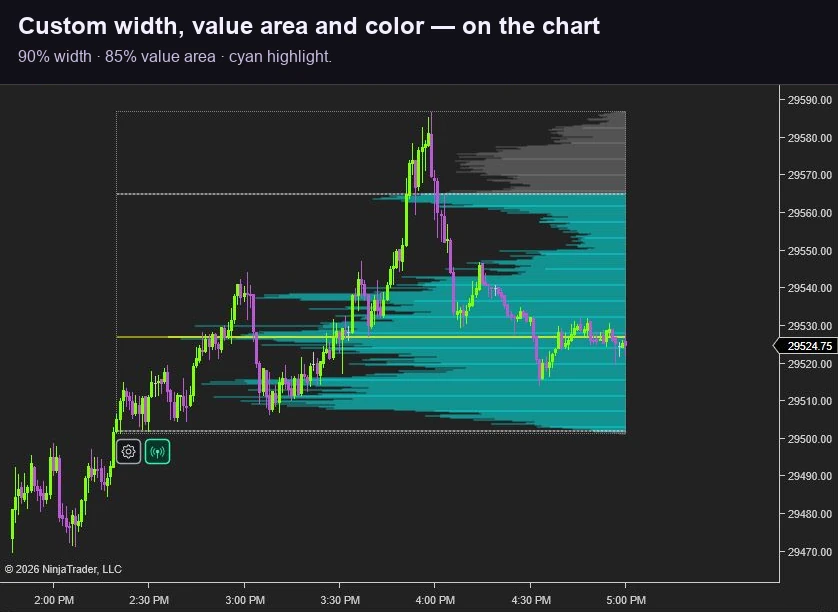
Control width, value area and colors
Set Profile width (%) from 10–100% and Value Area (%) from 10–90%. Choose a compact histogram or give the volume structure more space, and use the value-area percentage that suits your analysis.
Customize the value-area and outside-area colors and opacity, buying and selling colors, POC and value-area line styles, and the profile border. In the combined mode, adjust the delta panel separately.
Getting started in NinjaTrader 8
- Import the downloaded package: in Control Center, choose Tools → Import → NinjaScript Add-On, select the ZIP file and follow the prompts. Restart NinjaTrader if requested.
- Open a chart with data: connect your data feed or use Playback with recorded data available for the selected instrument and period.
- Select the drawing tool: open the chart’s Drawing Tools menu and choose Hameral Order Flow Anchored Volume Profile. This is a drawing tool, rather than an entry in the Indicators dialog.
- Choose the range: click the starting point, then the ending point. Allow the requested tick data to load and the profile to calculate.
- Open its settings: use the profile’s gear shortcut, or open Drawing Objects and select the profile. Choose the display mode, line settings, width, value area and colors.
- Choose fixed or live: leave Calculate Until Last Bar off for a fixed historical range. For a growing profile, enable it together with Calculate tick by tick. For fixed historical reference levels, enable Extend Lines to Right and the POC/value-area lines.
Data check: the selected period needs historical tick data. Bid/ask classification uses available quote information, with a price-direction fallback when usable bid/ask quotes are missing; the result depends on the data supplied. If the profile is empty, check the connection, instrument, selected dates and tick-data availability before changing the display settings.
License: the 14-day trial starts automatically after installation. Lifetime licenses are generated manually, usually within a few hours; allow the stated processing window in your order instructions.
Examples

Volume Profile Examples