Hameral Cumulative Delta
Cumulative Delta is running total of buy vs. sell volume, used to reveal real market pressure and confirm or anticipate price direction.

✔️LifeTime License ✔️ Free Updates ✖️ No Order Flow+ Needed
💳 All Major Cards
✖️ VAT Not Included
Description
See the buying and selling pressure behind price with Hameral Cumulative Delta for NinjaTrader 8. Follow accumulated delta across a session, or switch to delta bars to examine the activity inside each individual candle.
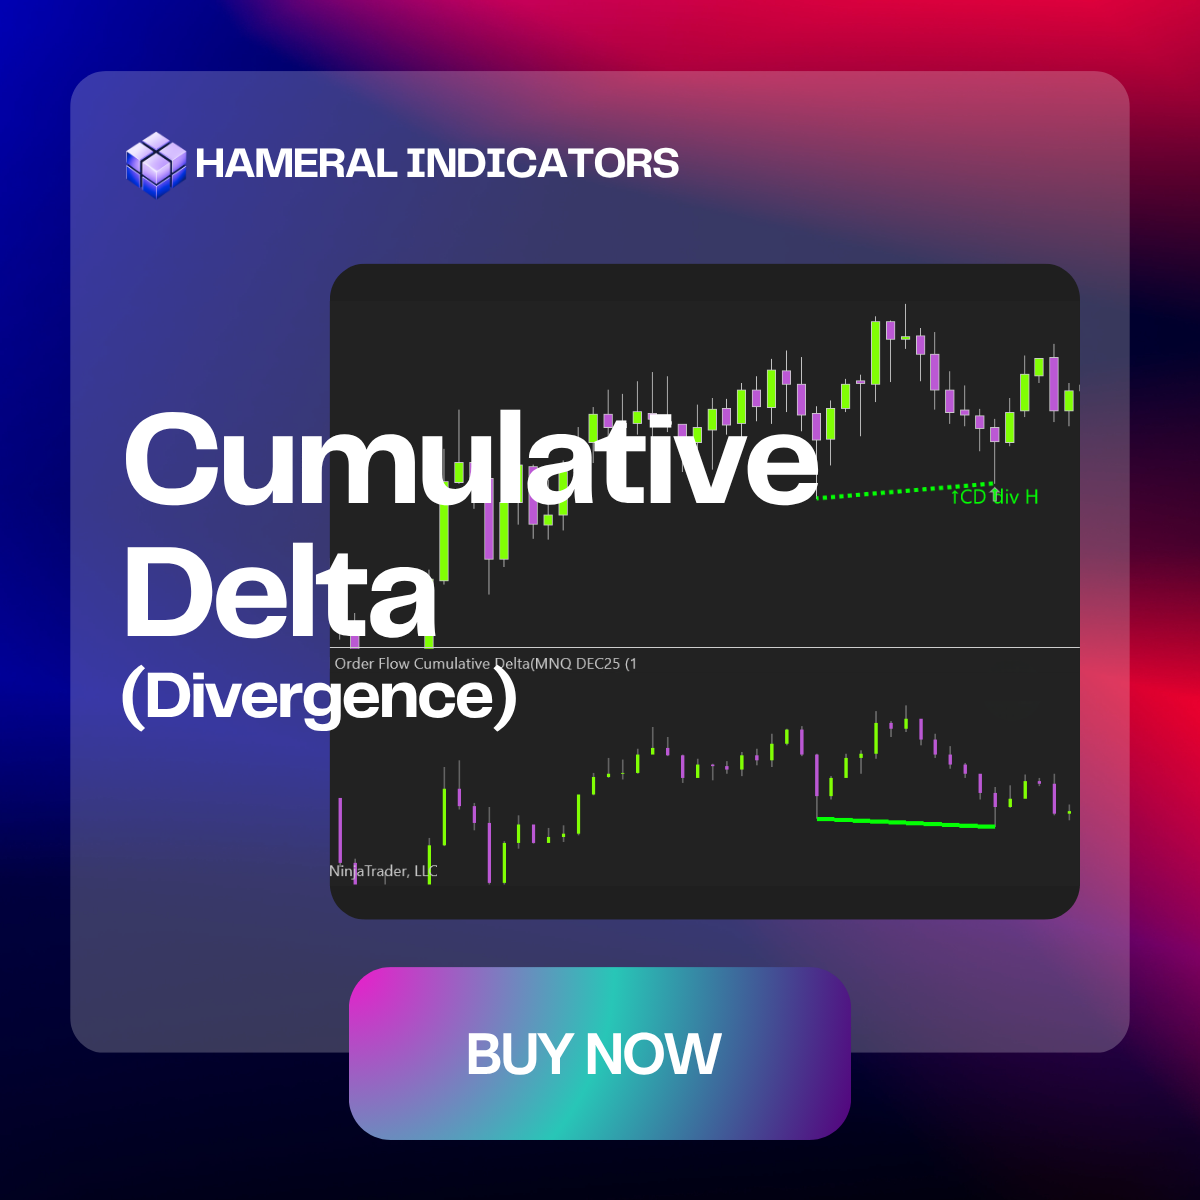
Compare price swings with delta to see whether participation supports a move or starts to disagree with it. Automatic regular and hidden divergence detection helps you find those differences, with optional provisional lines for divergences that are still developing.
Start fresh each trading session or continue accumulating delta across the loaded chart. Adjust candle colors, divergence markers, scaling and the current-value label to build a display that is comfortable to read alongside your price chart.
One indicator. Two delta views. Clearer context for your own market analysis.
Features & Setups
1. Cumulative Delta or Delta Bars — Choose Your Perspective
Switch between the bigger picture and individual candle activity from one setting. Cumulative mode carries delta forward from bar to bar; EachBar mode starts every new bar at zero.
- Cumulative: follow how buying and selling pressure builds over the calculation period.
- EachBar: compare the net buying and selling volume of individual price bars.
- Delta candlesticks: see open, high, low and close values in a separate panel beneath price.
- Setup: open the indicator settings, expand 01. Delta Style, and change Choose the style here to Cumulative or EachBar.

2. Reset Each Session or Keep Delta Running
Choose the time context that fits your analysis. Begin each session from zero for a fresh intraday view, or continue accumulating across the loaded sessions for a broader view of participation.
- Session reset: enable Reset on new session to restart cumulative delta at each trading-session boundary.
- Continuous calculation: disable that setting to carry the running total across the loaded chart history.
- Session-aware divergences: when cumulative delta resets each session, divergence comparisons do not cross those reset boundaries.
- Setup: select Cumulative mode, then expand 04. Parameters. To examine continuous delta across several sessions, also disable Calculate Only The Current Session and load the relevant history.

3. Automatic Divergences — See When Price and Delta Disagree
Let the indicator compare price pivots with cumulative delta instead of checking every swing manually. Highlight regular and hidden divergences on the price chart and, optionally, on the delta panel too.
- Confirmed divergences: appear after the configured pivot-strength requirement is met.
- Provisional divergences: show potential disagreements before confirmation. These can change or disappear; they are not confirmed signals.
- Control sensitivity: adjust pivot strength, the maximum distance between pivots, price tolerance in ticks and delta tolerance in percent.
- Choose the markers: show or hide lines, arrows and text, and select bullish, bearish and provisional colors.
- Setup: use Cumulative mode. Configure confirmed detections under 02. Divergences and developing detections under 03. Provisional Divergence.
Divergences describe a disagreement between price and delta. Assess them within your wider chart context; they do not guarantee a reversal or continuation.

4. Colors and Display — Make Delta Easier to Read
Build a clear delta panel that fits your workspace. Give bullish and bearish candles distinct colors, adjust their width, and keep the current delta value readable as you zoom or move through the chart.
- Candle styling: customize bullish and bearish colors and candle-body width.
- Reference styling: choose the zero-line color and the level-marker background and text colors.
- Readable scaling: scale to visible bars and adjust vertical padding.
- Current-value label: show or hide the level marker and change its font size.
- Setup: use 05. Colors & Style for appearance, and 04. Parameters for scaling, padding and the value marker.

Getting Started in NinjaTrader 8
- Import your downloaded Hameral ZIP through Tools → Import → NinjaScript Add-On.
- For historical tick-by-tick calculation, enable Show Tick Replay under Tools → Options → Market Data. In versions that call this menu Settings, open the equivalent Market Data category.
- Open the chart’s Data Series window, enable Tick Replay on the primary series, and apply it. Your data connection must supply suitable historical tick data.
- Right-click the chart, choose Indicators, and add Hameral Order Flow Cumulative Delta.
- Choose your delta mode, session behavior and display settings, then apply your changes.
Keep loading times manageable: begin with a short history window. Enable Calculate Only The Current Session when you only need the newest session; leave it disabled when comparing several sessions or continuous delta. Longer Tick Replay histories require more processing.
Examples