💡 PRO ORDERFLOW PACK
PRO Footprint Indicator for NinjaTrader8

📌 What is Footprint Indicator for NinjaTrader 8?
The PRO Footprint Indicator for NinjaTrader 8 is a professional order flow tool that shows the real traded volume at bid and ask inside each candle. You instantly see who’s in control (buyers or sellers), where absorption occurs, and where moves are likely to start.
Quickly spot imbalances, track delta & cumulative delta, and visualize support/resistance zones created by stacked imbalances or absorption – fully customizable to fit your chart style.

🔍 What are the Footprint Key Functions?
🔔 01. Footprint Absorbtion Telegram Alerts

Get real-time notifications when absorption zones are detected.
- Enable Telegram Alerts – Turn on/off external alerts via Telegram.
- Telegram Bot Token – Your bot’s API token (from @BotFather).
- Telegram Chat ID – Your user or group chat ID (where messages will be sent).
- Absorption Alert Message – Custom template. Use:
{EMOJI},{INSTRUMENT},{TYPE},{PRICE}.
Default template:{EMOJI} Absorption Alert Instrument: {INSTRUMENT} Type: {TYPE} Price: {PRICE} - Alert on Bar Close Only – If checked, alerts fire only after the bar closes
(confirmed zones). If unchecked, alerts can trigger intrabar in real time.
(e.g., 🐻/🐂) for instant context on mobile.
🐂 Absorption Alert
Instrument: ES 06-25
Type: Support
Price: 5234.25
")
02. Footprint Display
The Footprint Display settings control how trade volume is shown inside each candle
and how many historical bars are visible on the chart.
- Show Volume Numbers – Toggles the display of volume values inside the footprint cells.
- Volume Display Format – Defines how numbers are displayed (e.g., full numbers, rounded, or abbreviated).
- Show Historical Bars – When enabled, keeps past bars visible for historical order flow analysis.
- Historical Bars Count – Sets the number of past bars displayed (default 100).
Display raw volume numbers inside candles for precise trade flow analysis, or keep them hidden
for a cleaner chart. Adjust historical bar count to review past order flow and identify repeating patterns.
03. Footprint Style

The Footprint Style settings let you fully customize how order flow data is displayed.
From font size and colors to imbalance highlights and delta heatmaps, you can shape the chart to match
your trading style and make key signals stand out.
- Font Size / Normal Text Color – Adjust the size and color of the numbers inside the footprint.
- Imbalance Ratio – Sets the threshold (e.g.,
1.5x) for marking a bid/ask imbalance. - Bid / Ask Imbalance Color – Choose colors to highlight aggressive selling (bid) and buying (ask).
- Show Delta Heatmap Background – Colors the cell background based on delta.
The intensity of the color changes with delta size: the stronger the imbalance between buys and sells, the darker or brighter the shading. - Level Delta BG (Bid/Ask) Colors – Set the base colors for selling (bid) and buying (ask) pressure in the delta heatmap.
- Level Delta Opacity – Adjusts the transparency of the delta shading.
- Show POC Outline / POC Color – Displays the Point of Control (POC), the price level with the highest traded volume.
Quickly spot aggressive buying or selling by watching the color intensity in the delta heatmap.
Highlight stacked imbalance zones for hidden support/resistance, and use the POC outline to anchor key intraday structure.
04. Candle Delta

The Candle Delta feature displays the net difference between buy market orders and sell market orders inside each candle. This makes it clear whether buyers or sellers were more aggressive during that bar.
- Show Candle Delta – Toggle the delta display on or off.
- Delta Offset Below – Distance (in pixels) below the candle where the delta value is shown.
- Delta Font Size – Sets the size of the delta text.
- Positive Delta Color – Color when buy orders (ask volume) dominate.
- Negative Delta Color – Color when sell orders (bid volume) dominate.
- Neutral Delta Color – Color when buying and selling pressure are nearly equal.
Instantly see buyer or seller dominance in each candle. A green positive delta shows strong buying pressure, a red negative delta signals aggressive selling, and white highlights a balanced market.
05. Footprint Delta Histogram

The Delta Histogram plots a bar chart next to each candle, showing the net delta (buy volume minus sell volume). This makes it easy to spot whether buyers or sellers were dominant during that bar, with a clear
visual representation of the strength.
- Show Delta Histogram – Toggle the histogram on or off.
- Histogram Width – Adjusts the width of each histogram bar.
- Histogram Offset – Sets the spacing between the price bar and the histogram.
- Histogram Thickness – Defines how bold or thin the histogram bar appears.
- Positive Histogram Color – Color of the histogram when buy volume dominates (e.g., LimeGreen).
- Negative Histogram Color – Color of the histogram when sell volume dominates (e.g., Red).
Quickly gauge order flow pressure by looking at histogram size and color.
Larger green bars indicate strong buying dominance, while large red bars
highlight aggressive selling. Perfect for confirming market sentiment at a glance.
06. Delta Info Panel

The Delta Info Panel provides a detailed summary of order flow statistics for each bar, giving you quick insight into volume, delta, and session-level data. It is highly customizable in both layout and color, allowing you to highlight what matters most.
- Show Delta Info Panel – Toggles the info panel display on or off.
- Panel Row Height / Font Size – Adjusts spacing and text size for readability.
- Panel Text Color – Sets the color of the text inside the panel.
- Show Cell Separators – Displays separators between data cells.
- Separator Color / Opacity / Thickness – Fully customize the separator lines.
- Show Delta – Displays net delta for the bar.
- Show Volume – Shows total traded volume in the bar.
- Show Max Delta / Min Delta – Highlights the extremes of buy/sell pressure inside the bar.
- Show Delta Change – Displays the change in delta compared to the previous bar.
- Show Session Delta – Tracks cumulative delta for the entire session.
- Positive / Neutral / Negative BG Colors – Background colors for cells based on delta sign (buying, balanced, or selling).
- Volume BG Color – Background color for the volume field.
Use the Delta Info Panel to get a quick numeric summary of each bar.
Spot extremes in buy/sell pressure, track cumulative session delta, and
instantly read volume flow without scanning the entire footprint.
Perfect for traders who want both a visual and numeric perspective.
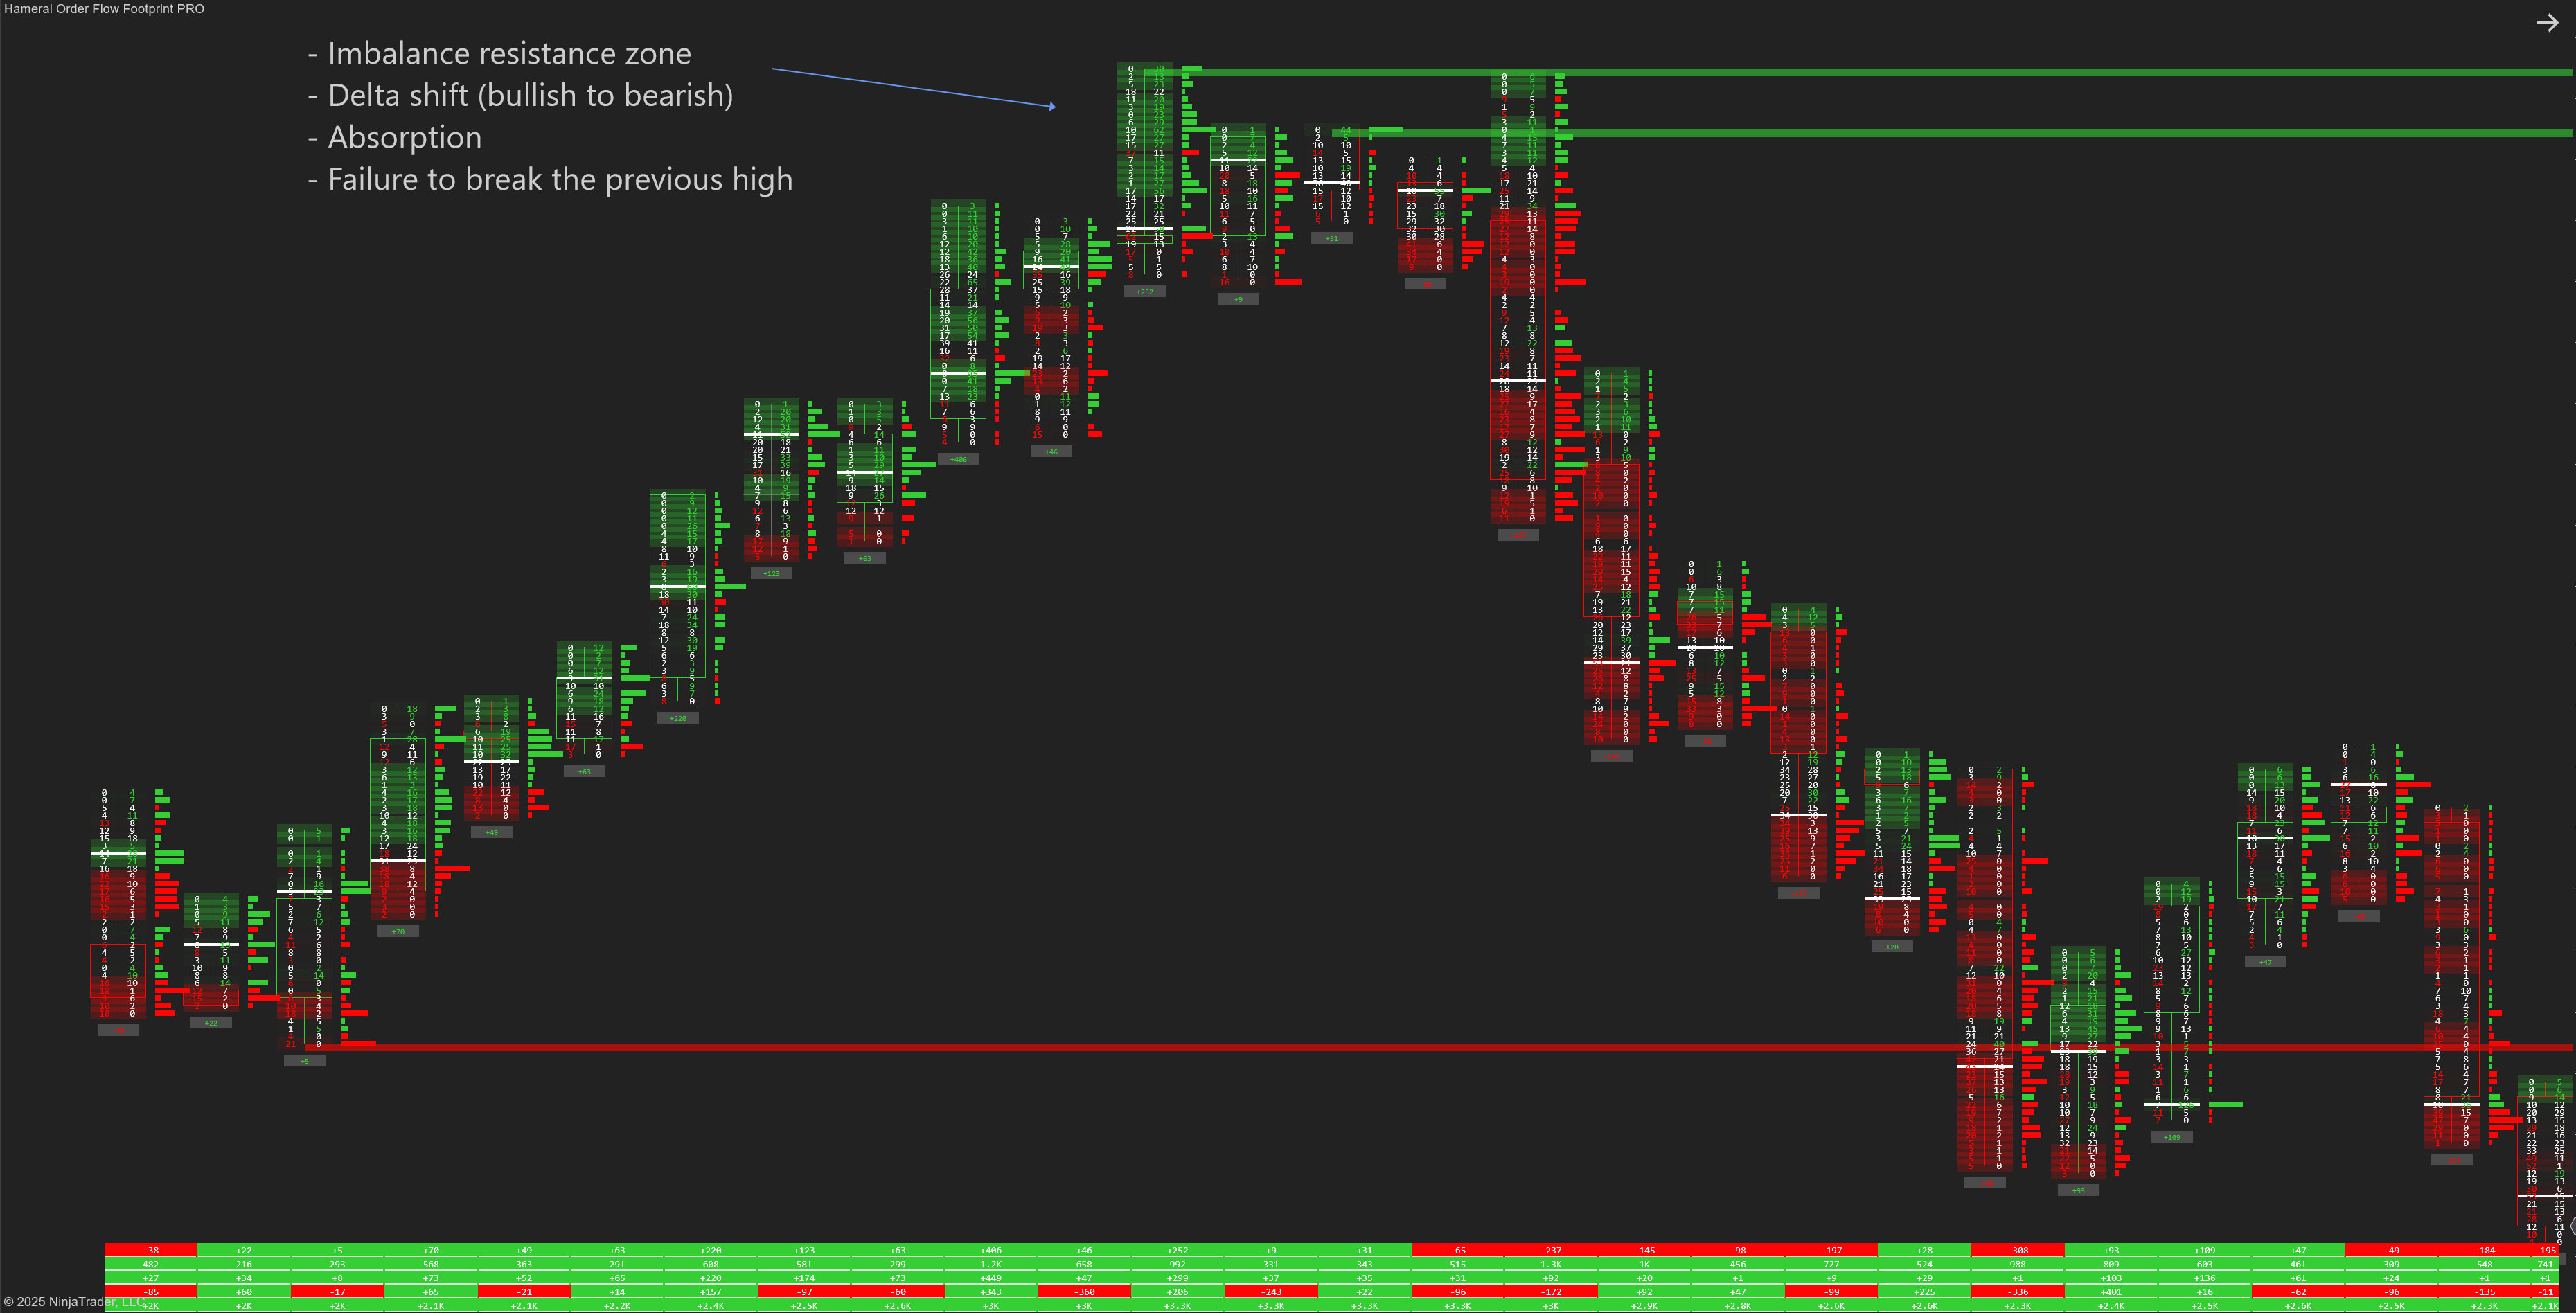
07. Imbalance Zones

⚡ This one is important because imbalance zones often act as hidden support/resistance.
The Imbalance Zones feature automatically highlights areas
where aggressive buying or selling occurred, often acting as hidden
support or resistance. These zones help you identify levels
where the market is likely to react again.
- Show Imbalance Zones – Toggle imbalance zone detection on or off.
- Imbalance Zone Volume Filter – Minimum traded volume required to validate an imbalance zone.
- Consecutive Imbalance Levels – Number of stacked imbalances needed to form a zone (e.g., 3 levels).
- Detect Imbalance on Native Ticks – Improves detection accuracy by using tick-level data.
- Support Zone Color (from Ask) – Highlight buy imbalances that often act as support (default: LimeGreen).
- Resistance Zone Color (from Bid) – Highlight sell imbalances that often act as resistance (default: Red).
- Imbalance Zone Opacity – Controls the transparency of highlighted zones.
- Stop Imbalance Zone on Touch – Option to remove the zone once price touches it again.
Spot key order flow levels where aggressive buyers or sellers previously stepped in.
Use these zones as potential trade entry or exit areas, or as confirmation of
support and resistance in your strategy.
08. Absorption Zones
✨ This section is powerful for spotting hidden liquidity.

The Absorption Zones feature highlights areas where large passive orders absorb aggressive buying or selling. These zones often act as strong turning points or barriers in the market.
- Show Absorption Zones – Enable or disable absorption zone detection.
- Absorption Consecutive Levels – Number of price levels that must show absorption to form a valid zone.
- Absorption Percent – The minimum percentage of absorbed volume required to confirm absorption (e.g., 70%).
- Absorption Depth (Ticks) – Defines how many ticks above/below price are analyzed for absorption.
- Absorption Volume Filter – Minimum traded volume required for an absorption zone to be valid.
- Support Zone Color (from Bid) – Highlights bid absorption that may act as support (default: LimeGreen).
- Resistance Zone Color (from Ask) – Highlights ask absorption that may act as resistance (default: Red).
- Absorption Zone Opacity – Adjusts the transparency of highlighted absorption areas.
Absorption zones show where strong hidden buyers or sellers are holding the market.
For example, heavy bid absorption may create a support level where price is likely to bounce,
while ask absorption can act as resistance and trigger reversals.
09. Price Grouping
")
The Price Grouping feature combines multiple price levels into a single footprint cell. This is especially useful in thin or fast markets where tick-by-tick data may be too granular to read clearly.
- Enable Price Grouping – Activates grouping of price levels into larger blocks.
- Custom Tick Multiplier – Defines how many ticks are grouped together (e.g., 2 = combines 2 ticks into one cell).
Smooth out the footprint in markets with high volatility or low liquidity.
Grouping prices helps reduce noise and makes imbalances and absorption zones
easier to spot at a glance.
10. Filtering
The Filtering setting removes small, insignificant trades from the footprint,
allowing you to focus only on meaningful order flow activity.
- Minimum Volume Filter – Ignores volume below the specified threshold (e.g., filter out trades smaller than 10 contracts).

11. Performance
The Performance setting optimizes chart responsiveness by limiting how many price levels are processed.
- Max Price Levels – Maximum number of price levels displayed per bar (higher values = more detail, lower values = faster performance).
12. Footprint Position
The Footprint Position settings control where the footprint is drawn relative to the price bars,
and how it scales when zooming in or out.
- Footprint Offset Right – Adds spacing between the footprint and the latest price bar.
- Auto Scale with Zoom – Automatically adjusts footprint size when you zoom the chart.
- Scale Factor – Manually increase or decrease the footprint’s overall size.
Filter out market noise by ignoring small trades, improve chart performance by
controlling price level detail, and adjust footprint positioning so it fits
perfectly with your chart layout and zoom level.
📘 How to Use Footprint PRO?
The Hameral Footprint PRO is designed to offer maximum control over order flow reading. You can customize what data is displayed inside each candle, whether you want to see raw volume, delta values, absorption zones, imbalance highlights, or detailed session stats. It works best when combined with:
- 🔍 Imbalance Highlighting to detect aggressive market orders
- 🧲 Absorption Zones to reveal passive limit order activity
- 📊 Delta Panel and Histogram for momentum confirmation
This indicator is most powerful on lower timeframes (e.g., 1-minute, 3-range, 8-tick) for scalping or high-precision entries, but it also provides valuable insight on higher timeframes when analyzing accumulation or distribution.
⚠️ Important Warning
Because this indicator displays deep order flow and real-time trade activity, settings must be adjusted per instrument. Each market (NQ, ES, CL, GC, etc.) has its own volume behavior and volatility profile. Test different combinations of:
📌 Imbalance Ratio & Volume Filter
📌 Absorption Percent & Depth
📌 Font size, opacity, and volume filters
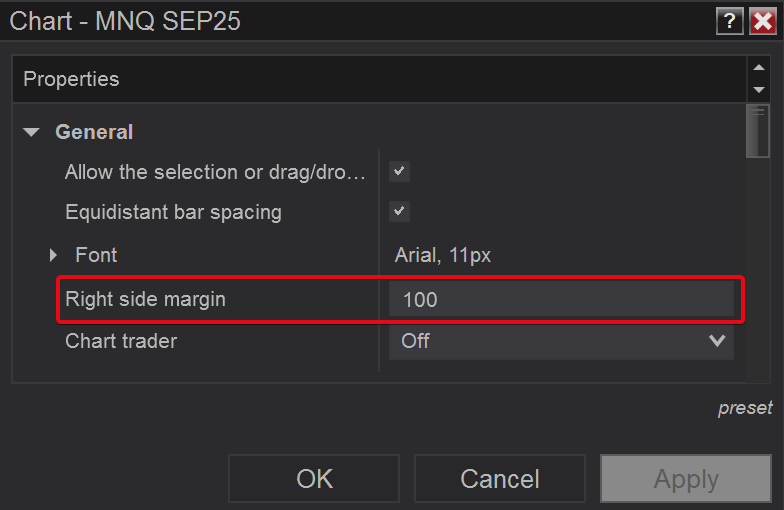
If you want to see the table text better, increase the right side margin.
Right click on the chart -> Properties -> Right side margin
🛠️ How to add Footprint it NinjaTrader 8?
- Download the pack: HameralOrderFlowIndicatorsPRO.zip
- In NinjaTrader, go to Tools → Import → NinjaScript Add-On
- Select the ZIP file and click Open
- Restart NinjaTrader 8
- Right-click chart → Indicators → Search “Hameral”
- Add it to your chart and customize it
📥 Get The Order Flow Basic Pack For FREE
Just sign up for our newsletter and get the full Hameral Basic Order Flow Pack instantly. This includes:
- ✅ Volume Profile Basic
- ✅ VWAP Basic
- ✅ Delta Bars Basic
- ✅ Footprint Basic
- 🎁 Bonus: Super Oscillator + Trading Template
💼 Need Advanced Order Flow Tools?
Looking for more flexibility and institutional-grade control? You’ll love the Hameral Pro Order Flow Pack, which includes:
- 📊 Session-by-session & Multi-Timeframe Volume Profiles
- 📌 Anchored Volume Profile
- 📈 Multi-Session VWAP with Standard Deviation Bands
- 📍 Anchored VWAP
- 📉 Cumulative Delta
- 🕯️ Advanced Footprint Chart — visualize order flow inside each candle, including absorption, delta, and more
- ⚡ Super Oscillator PRO with Market Extension Trigger
Frequently asked questions
Top Frequently-Asked Questions About Hameral Products
Do you have a refund policy?
No refunds. All sales are final once the license key is issued. We provide lifetime updates instead.
Installation steps?
Download the zip. Go to Tools -> Import -> NinjaScript Add-On -> Choose the zip file -> Ok.
Important! After the license is ready, close the platform and reopen it.
How to Get My Indicators Fast?
✅ After payment, you can download instantly the pack.
✅ Within 24 hours (usually much faster), your license will be activated and you can use the indicators.
✅ After Installation, you will find the indicators under Indicators tab in NinjaTrader.
✏️ Anchored Volume Profile and Anchored VWAP are drawing tools - just open your Drawing Tools (pen icon) to use them.
How to add the Templates in NinjaTrader 8?
Good to know:
- Templates are different from Workspaces.
- Templates are simple setups for a specific chart.
- Workspaces are the collection of all your charts.
Steps:
1. Unzip the Templates folder.
2. Go to: Documents -> NinjaTrader 8 -> templates -> Chart
Paste the templates here.
3. Open a new chart -> Right click -> Templates -> Load -> Select the desired template.
Where do I find Hameral indicators that I ordered?
You will find your indicators in your website account.
You can also download them directly from the email.
Where do I find the indicator properties and documentation?
Go to the menu and click on "NinjaTrader Indicators" → "Documentation".
Platform & version requirements?
NinjaTrader® 8 (build 8.1.2 or later). Works on either the free or lifetime license; no 3rd-party DLLs.
Can I try it before purchase?
No. To keep the code fully secure, we do not offer trials or demo keys.
But, you can download our FREE Indicators to test the quality of our products.
How do I update the indicators?
1. Remove the old assembly
- Tools -> Remove NinjaScript Assembly
- Choose the pack you want to update -> Click "Remove"
- When finished, close the platform.
2. Import the updated pack
- Tools -> Import -> NinjaScript Addon...
- Select the ZIP file with the indicators (do NOT unzip the pack), then click Open.
How to add the Workspaces in NinjaTrader 8?
1. Unzip the Workspace files.
2. Go to: Documents -> NinjaTrader 8 -> workspaces
Paste the workspace files here.
3. In the platform, open Workspaces and select the one you want.
If it doesn’t appear, restart the platform.
Where do I find the updated indicators and files?
Every time a new version is released, the old one will be replaced in your account on our website.
Make sure you save locally the version you purchased if you don’t want to use the updated versions.