
💡 PRO ORDERFLOW PACK
PRO Delta Profile Indicator for NinjaTrader8

📌 What isDelta Profile? Indicator Overview
The Hameral Delta Profile is a professional order flow tool that reveals where aggressive buyers and sellers are active at each price level during the trading session.
Instead of simply plotting total volume, it highlights the net delta – the difference between buy orders lifting the ask and sell orders hitting the bid – building a clear horizontal profile of buyer–seller imbalances at every price level.
With the Hameral Delta Profile, you can easily spot:
- 🔵 Buyer dominance zones – areas where aggressive buyers overwhelmed sellers (potential support).
- 🔴 Seller dominance zones – areas where aggressive sellers controlled the tape (potential resistance).
- 🛑 Absorption levels – where large buying or selling pressure failed to move price, signaling hidden liquidity.
- ⚡ Exhaustion or climax – extreme delta spikes at highs/lows that often mark reversals.
- 📉 Delta divergence – when price makes a new high/low but with weaker delta participation, revealing fading momentum.
By visually mapping buyer and seller imbalances, the Hameral Delta Profile allows traders to understand who is in control at key prices, improve trade entries, and combine order flow with classic support/resistance or volume profile strategies.
👉 In short: it’s not just about where trading happened – it’s about who was winning the battle at each price.
🔍 What are the functions of Delta Profile?
⚙️ Parameters
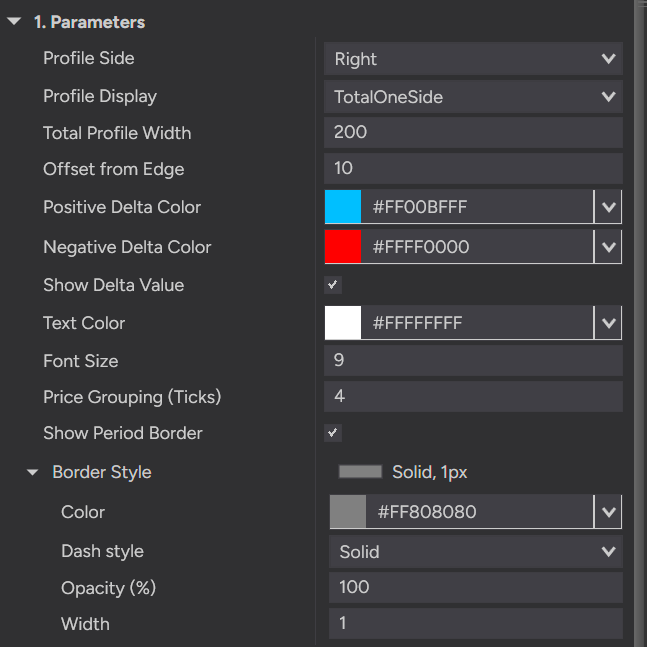
Profile Side: Chooses where the Delta Profile appears on the chart.
- Right: Displays the profile on the right side of the chart. Default setting.
- Left: Displays the profile on the left side of the chart.
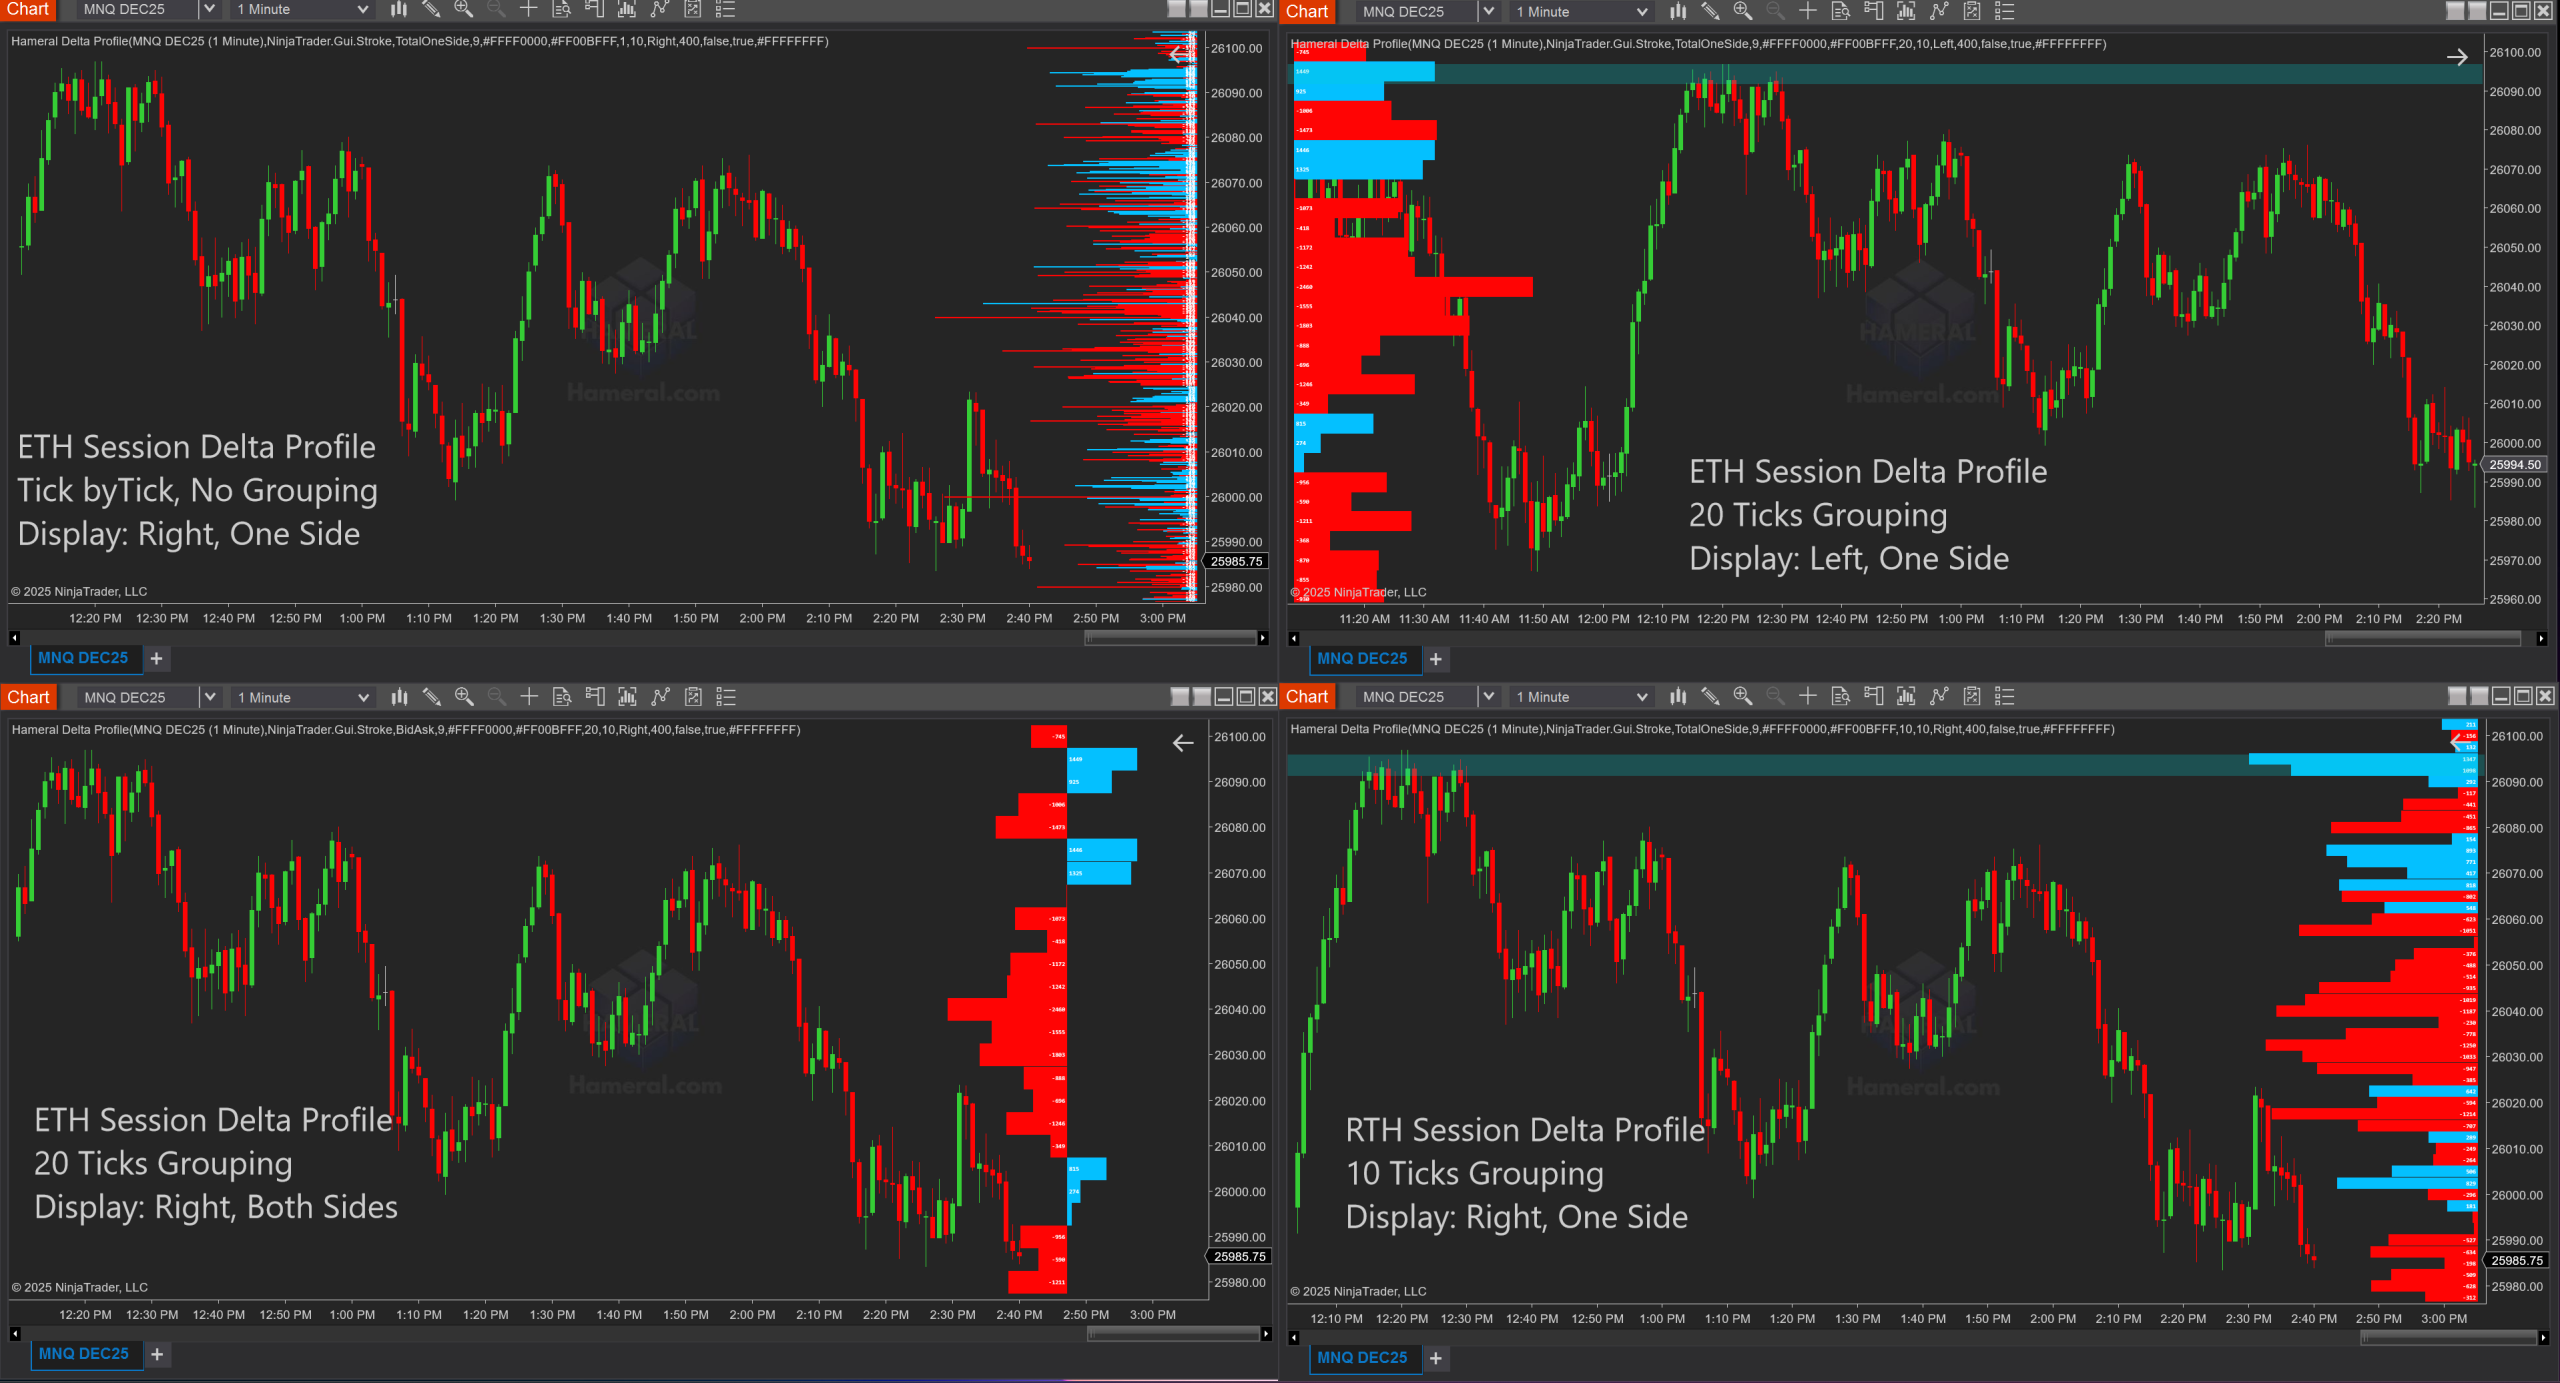
Profile Display: Controls how positive and negative delta bars are shown.
- TotalOneSide: Shows the full delta profile as one-sided bars. Default setting.
- BidAsk: Splits the profile from the center line, with selling delta to the left and buying delta to the right.
Profile Side: Chooses where the Delta Profile appears on the chart.
- Right: Displays the profile on the right side of the chart. Default setting.
- Left: Displays the profile on the left side of the chart.
Profile Display: Controls how positive and negative delta bars are shown.
- TotalOneSide: Shows the full delta profile as one-sided bars. Default setting.
- BidAsk: Splits the profile from the center line, with selling delta to the left and buying delta to the right.
- Total Profile Width (200): Controls how wide the delta profile histogram is drawn on your chart. Larger numbers = thicker bars, smaller = thinner.
- Offset from Right (10): Moves the entire profile away from the right edge of the chart. Useful if you don’t want it overlapping with price candles.
- Positive Delta Color (DeepSkyBlue): The color of buying imbalance bars (when buyers lift the ask more than sellers hit the bid).
- Negative Delta Color (Red): The color of selling imbalance bars (when sellers hit the bid more than buyers lift the ask).
- Show Delta Value (☑): Displays the actual numeric delta value inside the bars. If unchecked, only the bars appear without numbers.
- Text Color (White): The font color for the numbers inside the bars (when Show Delta Value is enabled).
- Font Size (9): Size of the delta numbers displayed inside the bars. Larger = more readable, smaller = more compact.
- Price Grouping (Ticks) (6): Groups price levels into clusters.
1 = every tick has its own delta.
6 = deltas are combined every 6 ticks, making the profile smoother and less noisy.
👉 These options let you customize the look and detail level of your delta profile so you can focus on the most important buyer vs. seller battles without clutter.
Show Period Border: Displays a rectangle around the active Delta Profile period, making it easier to see which candles and price range are included in the current profile.
Border Style: Controls how the period border looks on the chart.
- Color: Sets the border color. Default is gray.
- Dash Style: Choose solid, dashed, or other line styles.
- Opacity (%): Controls border transparency. 100% = fully visible.
- Width: Sets the border thickness. Default is 1px.
Note: This option is visual only. It does not change the delta calculation.
2. Time settings
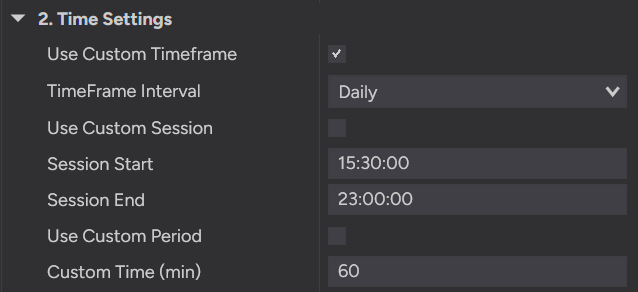
Time Settings
Time Settings: Controls when the Delta Profile starts, resets, and calculates a new profile period.
- Use Custom Timeframe: Builds the profile using a selected timeframe. Default is enabled.
- TimeFrame Interval: Choose 1 Min, 3 Min, 5 Min, 15 Min, 30 Min, 1 Hour, 4 Hours, Daily, or Weekly. Default is Daily.
- Use Custom Session: Limits the profile calculation to a specific trading session.
- Session Start / End: Sets the custom session time range. Default is 15:30 to 23:00.
- Use Custom Period: Creates repeating profiles based on a custom minute interval.
- Custom Time (min): Sets the custom period length. Default is 60 minutes.
In short: This section lets you choose when the Delta Profile starts and resets. You can display the profile based on a selected timeframe, a specific trading session, or a custom time period.
- Use Custom Timeframe: Builds a new profile using a selected interval such as 1 Min, 5 Min, 1 Hour, Daily, or Weekly.
- Use Custom Session: Displays the profile only during a specific session, using the Session Start and Session End times.
- Use Custom Period: Creates repeating profiles based on a custom number of minutes, such as every 60 minutes.
Example: You can create a daily delta profile, a profile only for the New York session, or a new profile every 60 minutes.
Tip: For cleaner results, use the time mode that matches your trading style: timeframe, session, or custom period.
3. Leg-toLeg


The Leg-to-Leg Delta Profile allows you to analyze the buying and selling aggression for a specific price movement instead of a fixed time period. Simply select the beginning and end of a market leg, and the indicator builds a Delta Profile for that entire move.
This helps you understand where buyers or sellers were most aggressive during the selected swing, identify key Delta concentration areas, and compare market participation between different legs.
How to use:
- Hold CTRL and left-click the chart to select the starting point.
- Hold CTRL and left-click again to select the ending point.
- The Delta Profile is automatically calculated for the selected leg.
Perfect for analyzing impulse moves, pullbacks, breakouts, and measuring order flow within any custom market swing.
-
How to use Delta Profile?
Here are the most common way of using Delta Profile:
1. Absorption Strategy (Delta Trap)
Concept
When sellers (or buyers) push hard but price doesn’t move further, it means the opposite side is
absorbing those orders. That’s often a reversal signal.
How to spot it with Delta Profile
- Look for a big red bar (large negative delta) at a specific price level.
- Check if price fails to go lower despite heavy selling.
- That suggests strong buyers are absorbing at that level.
Trade idea
- Go long near that level if price rejects it.
- Place the stop just below the absorption zone.
- First target: recent swing high.
🔎 Example scenario
Price falls into 15000.00 (NQ).
Huge red delta prints at 15000.00 (tons of selling).
Instead of breaking lower, price bounces up.
→ Buyers absorbed sellers. Long entry confirmed.
2. Exhaustion / Climax Strategy
Concept:
Trends often end with aggressive traders “chasing” the move. The Delta Profile will show extreme delta spikes at the top or bottom of a run – but no continuation.
How to spot it with Delta Profile:
- Watch when price extends higher/lower after a trend.
- At the extreme, check if Delta Profile shows a very large bar (positive delta at highs, negative at lows).
- If price stalls or rejects after this, it’s exhaustion.
Trade idea:
- Fade the move (go short at extreme highs, long at extreme lows).
- Stop just beyond the extreme.
- Target = back to mid-range of prior move.
🔎 Example scenario:
NQ rallies strongly to 15200.
At 15200, Delta Profile shows a huge positive spike.
But price stalls and fails to break higher.
→ Buyers exhausted, short setup confirmed.
3. Delta Divergence (Delta vs Price)
Concept:
Price makes a new high (or low), but delta shows weaker participation (fewer aggressive buyers/sellers). This signals loss of strength and often a reversal.
How to spot it with Delta Profile:
- Compare two swing highs (or lows).
- On the new high, see if delta is smaller than on the previous one.
- That means fewer buyers supported the move = weakening trend.
Trade idea:
- Go short at weak new highs, or long at weak new lows.
- Stop just beyond the extreme.
- Target = last support/resistance area.
🔎 Example scenario:
Price makes a new high at 15300.
Delta Profile shows smaller positive delta than the high at 15280.
Buyers are weaker, move likely to fail.
→ Short setup.
✅ How to Practice These
- Load your Hameral Delta Profile indicator on a futures chart (NQ, ES, CL, etc.).
- Use a 5-min or tick chart for practice (delta is clearer on intraday).
- Each day:
- Mark where the biggest delta levels appear.
- See how price reacts when it returns there.
- Journal screenshots of absorption, exhaustion, and divergence.
⚡ Tip: These strategies are not standalone. Best results come when you combine Delta Profile with levels like VWAP, prior day high/low, or Volume Profile nodes.

⚙️ How to Enable Tick Replay in NinjaTrader
To make sure the Hameral Delta Profile calculates delta correctly, you need to enable Tick Replay on your chart:
- Right-click on your chart and select Data Series…
- In the Data Series window, scroll down to Tick Replay.
- Set Tick Replay = True.
- Click OK to reload the chart with tick-by-tick data.
Note: Tick Replay requires tick data from your broker or data provider. If not available, the delta values may not load correctly.
📥 Get The Order Flow Basic Pack For FREE
Just sign up for our newsletter and get the full Hameral Basic Order Flow Pack instantly. This includes:
- ✅ Volume Profile Basic
- ✅ VWAP Basic
- ✅ Delta Bars Basic
- ✅ Footprint Basic
- 🎁 Bonus: Super Oscillator + Trading Template
💼 Need Advanced Order Flow Tools?
Looking for more flexibility and institutional-grade control? You’ll love the Hameral Pro Order Flow Pack, which includes:
- 📊 Session-by-session & Multi-Timeframe Volume Profiles
- 📌 Anchored Volume Profile
- 📈 Multi-Session VWAP with Standard Deviation Bands
- 📍 Anchored VWAP
- 📉 Cumulative Delta
- 🕯️ Advanced Footprint Chart — visualize order flow inside each candle, including absorption, delta, and more
- ⚡ Super Oscillator PRO with Market Extension Trigger
Frequently asked questions
Top Frequently-Asked Questions About Hameral Products
Do you have a refund policy?
No refunds. All sales are final once the license key is issued. We provide lifetime updates instead.
Installation steps?
Download the zip. Go to Tools -> Import -> NinjaScript Add-On -> Choose the zip file -> Ok.
Important! After the license is ready, close the platform and reopen it.
How to Get My Indicators Fast?
✅ After payment, you can download instantly the pack.
✅ Within 24 hours (usually much faster), your license will be activated and you can use the indicators.
✅ After Installation, you will find the indicators under Indicators tab in NinjaTrader.
✏️ Anchored Volume Profile and Anchored VWAP are drawing tools - just open your Drawing Tools (pen icon) to use them.
How to add the Templates in NinjaTrader 8?
Good to know:
- Templates are different from Workspaces.
- Templates are simple setups for a specific chart.
- Workspaces are the collection of all your charts.
Steps:
1. Unzip the Templates folder.
2. Go to: Documents -> NinjaTrader 8 -> templates -> Chart
Paste the templates here.
3. Open a new chart -> Right click -> Templates -> Load -> Select the desired template.
Where do I find Hameral indicators that I ordered?
You will find your indicators in your website account.
You can also download them directly from the email.
Where do I find the indicator properties and documentation?
Go to the menu and click on "NinjaTrader Indicators" → "Documentation".
Platform & version requirements?
NinjaTrader® 8 (build 8.1.2 or later). Works on either the free or lifetime license; no 3rd-party DLLs.
Can I try it before purchase?
No. To keep the code fully secure, we do not offer trials or demo keys.
But, you can download our FREE Indicators to test the quality of our products.
How do I update the indicators?
1. Remove the old assembly
- Tools -> Remove NinjaScript Assembly
- Choose the pack you want to update -> Click "Remove"
- When finished, close the platform.
2. Import the updated pack
- Tools -> Import -> NinjaScript Addon...
- Select the ZIP file with the indicators (do NOT unzip the pack), then click Open.
How to add the Workspaces in NinjaTrader 8?
1. Unzip the Workspace files.
2. Go to: Documents -> NinjaTrader 8 -> workspaces
Paste the workspace files here.
3. In the platform, open Workspaces and select the one you want.
If it doesn’t appear, restart the platform.
Where do I find the updated indicators and files?
Every time a new version is released, the old one will be replaced in your account on our website.
Make sure you save locally the version you purchased if you don’t want to use the updated versions.