
Footprint PRO User Guide
This guide helps you install Hameral Order Flow Footprint PRO, set up your first NinjaTrader chart, and understand the terminal settings without needing to reload the indicator every time you make a change.
What This Indicator Does
We built Hameral Order Flow Footprint PRO to show what happens inside each candle: bid volume, ask volume, delta, imbalances, value area, POC behavior, absorption zones, and useful bar-by-bar statistics. Instead of reading only a normal candle body, you can see where aggressive buyers and sellers actually traded inside the bar.
Inside-the-candle volume
See bid and ask volume at each price level, not only the candle open, high, low, and close.
Order flow pressure
Use delta, max/min delta, delta %, ratio, trades, and volume/sec rows to understand who was more aggressive.
Reaction zones
Use imbalance and absorption zones to highlight areas where buyers or sellers may have reacted with force.
How To Install
Follow these steps in order. The goal is simple: import the NinjaTrader add-on, add the workspace and chart templates, restart the platform, then start from a clean chart.
Installation Steps
- Download the pack.
Save the Hameral Footprint PRO pack to your computer and keep the files together. - Import the add-on.
In NinjaTrader, go toTools → Import → NinjaScript Add-Onand select the Hameral add-on ZIP file. - Import the workspaces.
In NinjaTrader, go toImport → Workspaces, then choose the Hameral workspace file included in the pack. Repeat this step for each Hameral workspace if the pack contains more than one. - Copy the chart templates.
Unzip the templates folder, then copy the XML files intoDocuments\NinjaTrader 8\templates\Chart. - Restart NinjaTrader.
Close and reopen the platform so NinjaTrader loads the new add-on, workspaces, and templates correctly.
Before You Start
Keep the original downloaded pack somewhere safe. If you reinstall NinjaTrader or move to a new computer, you will need the add-on ZIP, the workspace files, and the chart templates again.
Do not unzip the NinjaScript Add-On ZIP before importing it. NinjaTrader needs the ZIP file exactly as delivered.
The chart template XML files should go into: Documents → NinjaTrader 8 → templates → Chart.
Set Up Your First Chart
Start with a fresh chart. Footprint charts use tick data, so the first setup matters a lot. A clean chart with a reasonable amount of loaded data will feel much faster.
- Open a fresh chart.
Create a new NinjaTrader chart for your market, preferably without other indicators at first. - Enable Tick Replay in Data Series.
Right-click the chart, openData Series, and checkTick Replay. If you do not see Tick Replay there, go toControl Center → Tools → Options → Market data, enableShow Tick Replay, press OK, then reopen the chart. - Limit the amount of loaded data.
In Data Series, chooseLoad data based on: Barsand setBars to loadto around50for the first test. Press OK. - Add the indicator.
Right-click the chart, openIndicators, search for Hameral Order Flow Footprint PRO, add it, then press OK. - Zoom in until the bid/ask numbers are readable.
If the footprint looks compressed, zoom in on the chart until the price-level numbers become clear. - Reduce the candle bar width.
Double-click one of the large candles, open the candle/bar settings, and reduceBar widthto around3. - Use the TERMINAL button for settings.
Click theTERMINALbutton on the top bar of the chart to change Footprint PRO settings instantly.

Do not use the standard indicator properties window for normal customization. The indicator properties window can force the indicator to recalculate. For instant setting changes, use the Hameral TERMINAL button from the chart top bar.
Clean Chart Recommendations
Keep the footprint chart clean
Use the footprint as a dedicated order flow chart. Avoid stacking many indicators on the same chart.
Use tick grouping when candles are too tall
If volatility makes the candles too large and the numbers hard to read, use Tick Group directly from the top bar: 1T, 2T, 3T, or 4T.
Do not overload Tick Replay
Do not load a huge amount of historical bars with Tick Replay. The calculation will take more time and can slow the workspace.
Settings At A Glance
The Footprint PRO Terminal is organized into 6 setting groups. Appearance covers display, style, and positioning, while the remaining groups handle analytics, zones, alerts, data/performance, and product information.
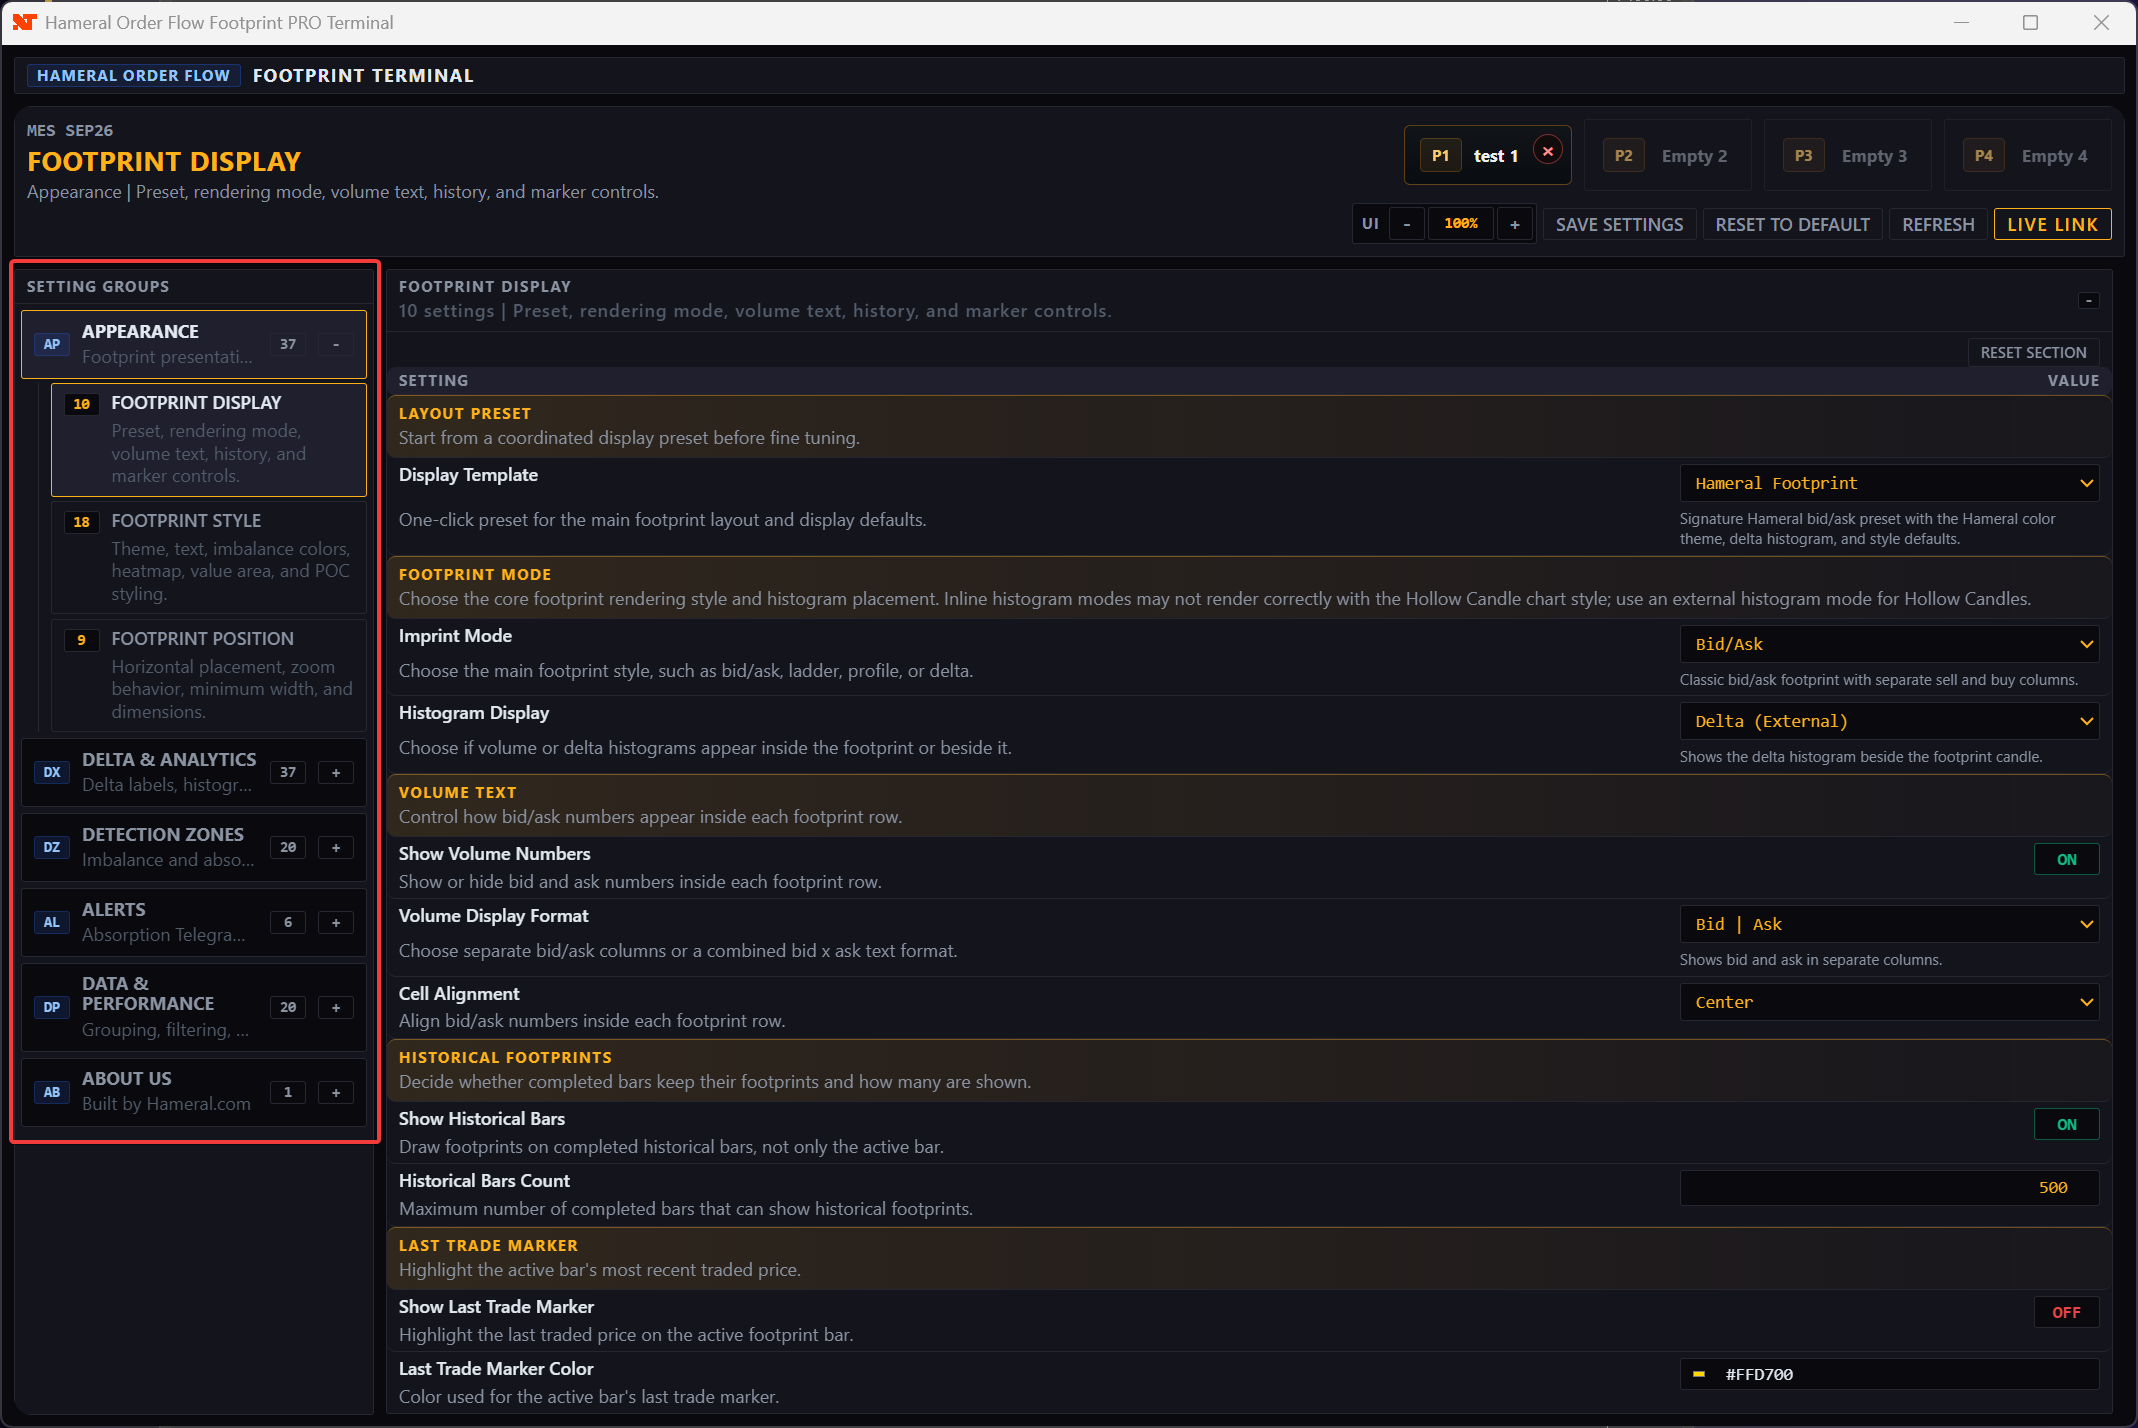
Appearance
Controls display templates, footprint mode, colors, font size, value area, POC, and chart positioning.
Delta & Analytics
Controls delta labels, bottom panel rows, heatmap backgrounds, and separator styling.
Detection Zones
Controls imbalance zones, absorption zones, support/resistance zones, and detection filters.
Alerts
Controls supported alerts for detection events, especially absorption-related signals.
Data & Performance
Controls grouping, filtering, data handling, and performance-sensitive settings.
About Us
Product information, website, and Hameral support reference.
EXPLORE THE FOOTPRINT TERMINAL
1. Footprint Display
This section controls the main footprint layout, how each candle is displayed, how the histogram appears, and how much information is shown on historical bars.
Layout Preset
Display Template lets you load a ready-made footprint layout before you start manual customization.
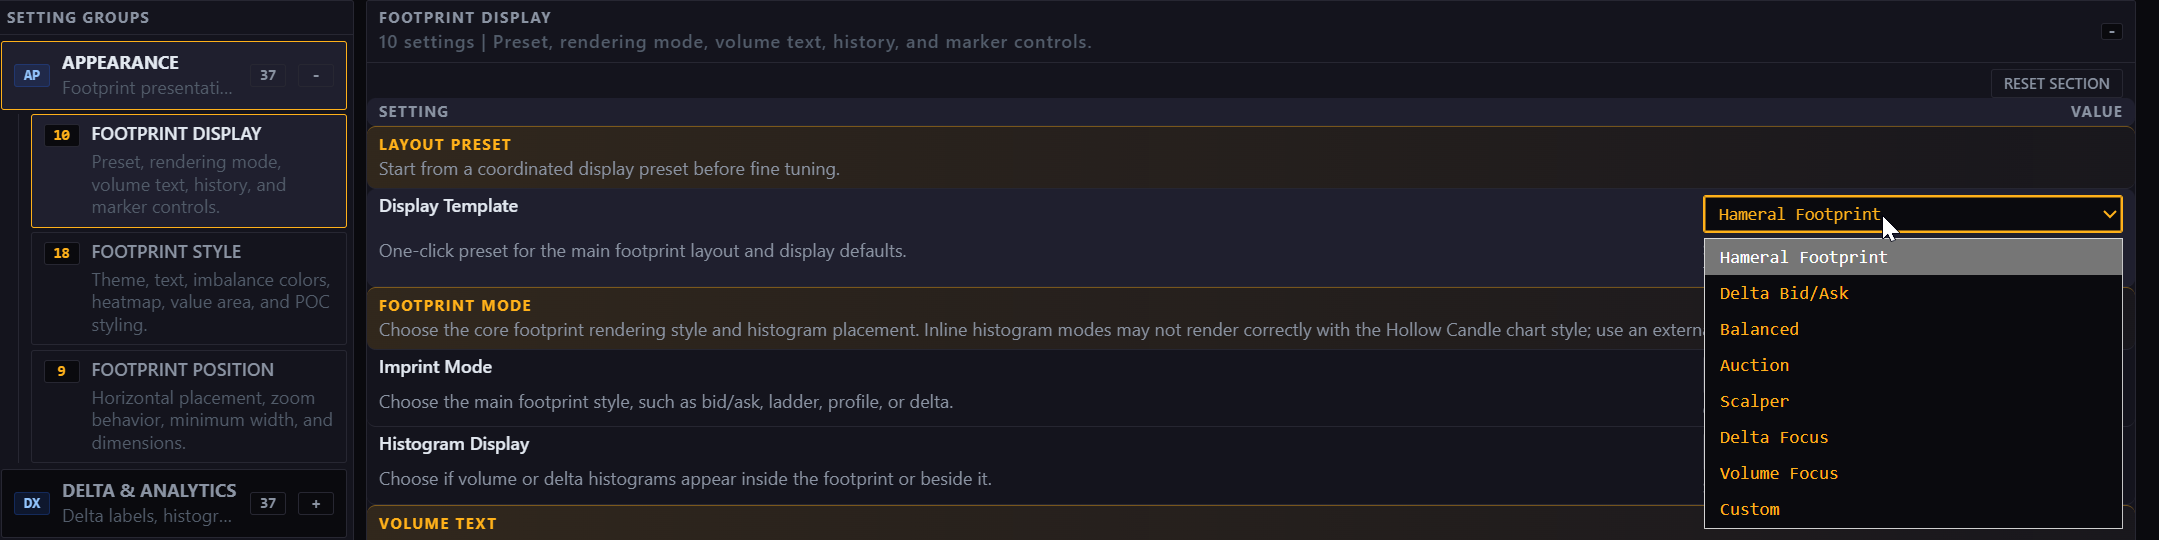
Display Template
Loads a complete visual preset so the footprint starts with a proven combination of display, histogram, analytics, and style settings.
Start with a preset when you want a fast setup. Move to Custom after that if you want to keep your own combination of settings.
- Hameral Footprint: signature Hameral bid/ask layout with Hameral colors and delta histogram.
- Delta Bid/Ask: classic bid/ask footprint focused on delta with delta heatmap and external delta histogram.
- Balanced: clean bid/ask footprint with delta histogram and a full analytics panel.
- Auction: profile-focused layout with daily summary context and previous-session levels.
- Scalper: compact ladder-style view made for faster reading during quick market moves.
- Delta Focus: delta-first layout with stronger session and delta analytics.
- Volume Focus: volume-centered layout with volume histogram and profile-style analytics.
- Custom: keeps your own manual combination of display, histogram, layout, and style settings.
Footprint Mode
Footprint Mode controls how the information inside each candle is read and how extra histogram lanes are added around the footprint.
Imprint Mode controls the main way the footprint data is displayed inside each candle.
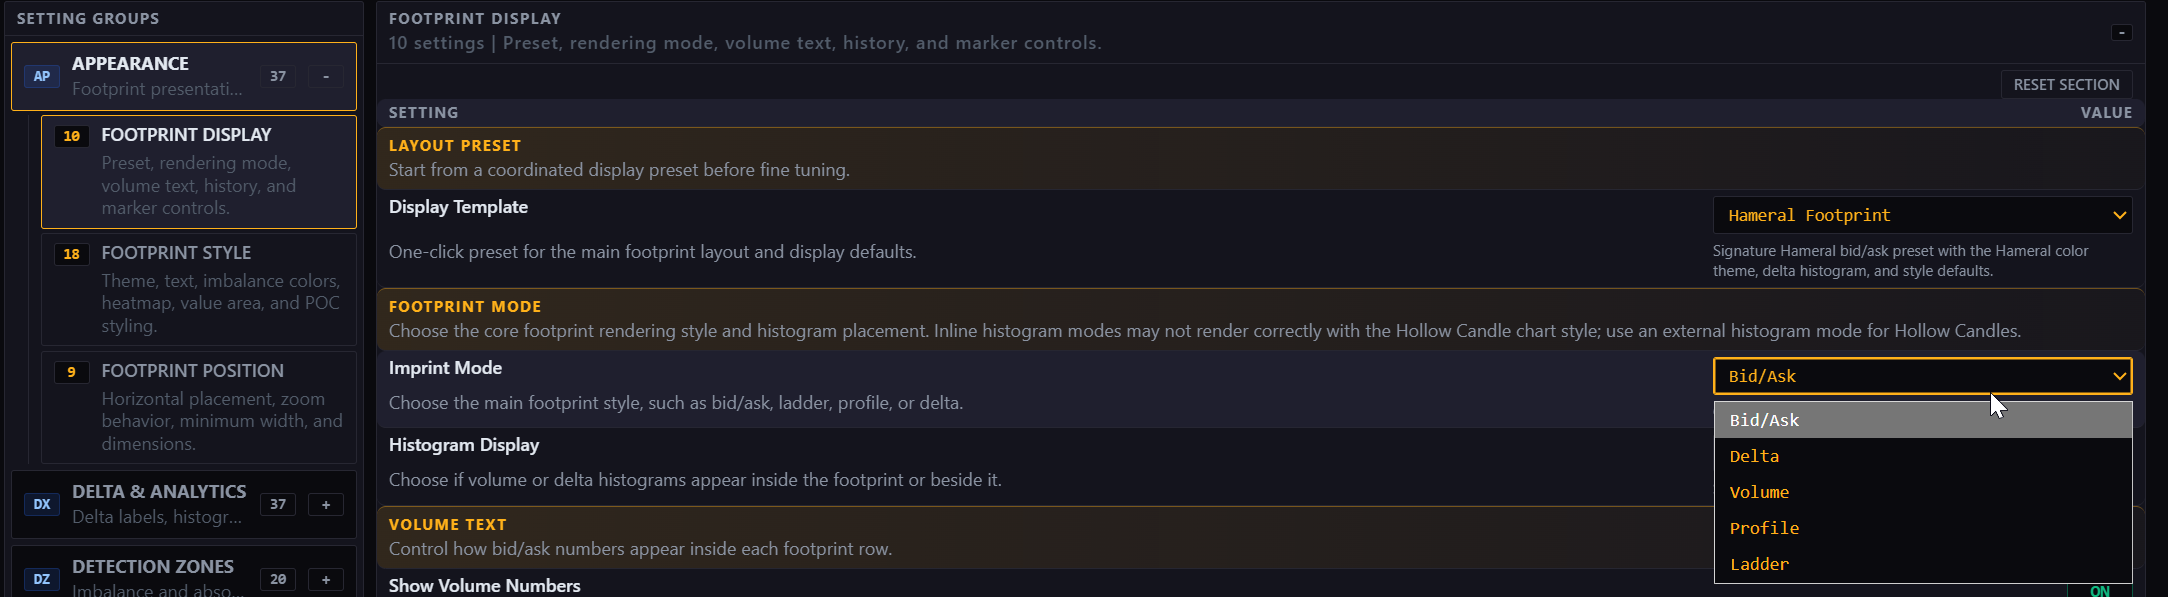
Imprint Mode
Changes the core reading style of each price row inside the footprint candle.
If you are learning classic order flow, start with Bid/Ask. If you want a cleaner directional read, move to Delta or Profile.
- Bid/Ask: shows separate bid and ask volume at each price level. Best for classic footprint reading.
- Delta: shows the difference between buying and selling volume at each price level.
- Volume: shows total traded volume at each price level without splitting bid and ask.
- Profile: displays each candle like a horizontal profile so high-volume zones stand out faster.
- Ladder: uses a compact bid/ask ladder style that is useful for fast reading and scalping.
Histogram Display controls if delta or volume histograms are shown inside the footprint candle or beside it.
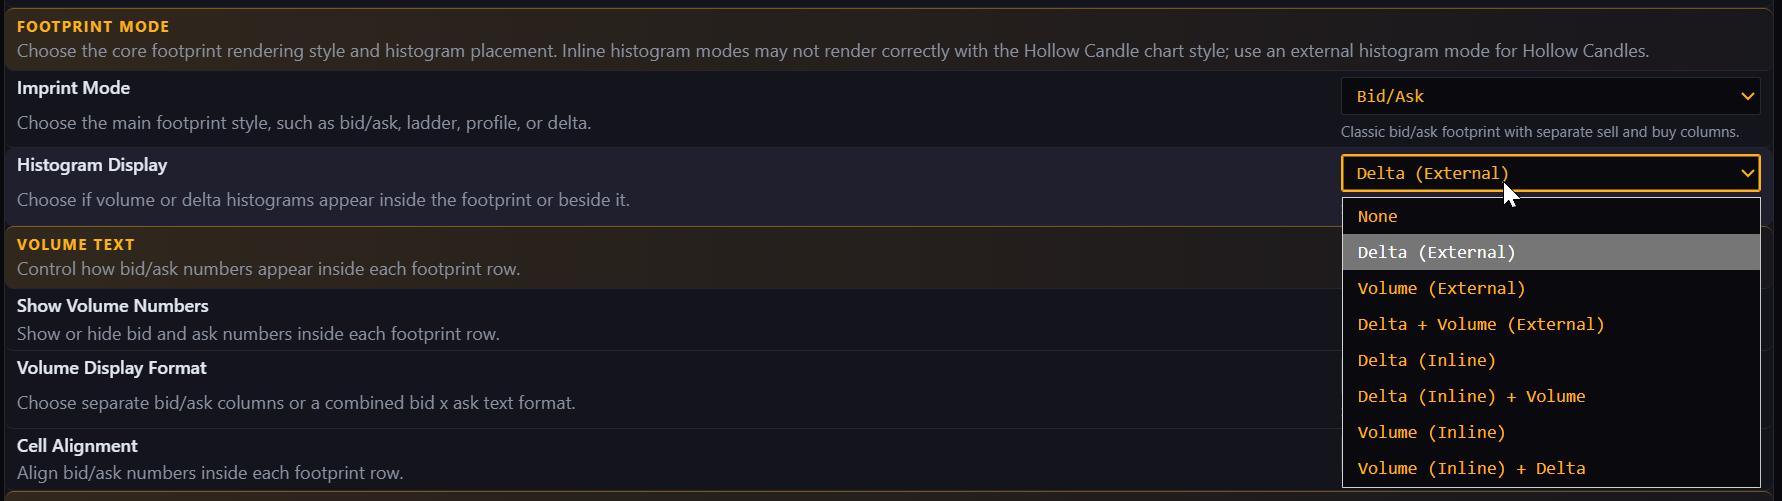
Histogram Display
Adds delta, volume, or both histograms either inline inside the footprint or as external lanes beside it.
External modes are usually easier to read. Inline modes save space but work best when the footprint is wide enough.
- None: hides the histogram completely.
- Delta (External): shows the delta histogram beside the footprint candle.
- Volume (External): shows the volume histogram beside the footprint candle.
- Delta + Volume (External): shows both delta and volume histograms beside the footprint candle.
- Delta (Inline): draws the delta histogram inside the footprint candle.
- Delta (Inline) + Volume: shows delta inside the candle and volume beside it.
- Volume (Inline): draws the volume histogram inside the footprint candle.
- Volume (Inline) + Delta: shows volume inside the candle and delta beside it.
For Hollow Candles, external histogram modes are recommended because inline histograms may not display correctly.
Volume Text
Volume Text controls if the price rows show numbers and how those numbers are arranged inside the footprint.

Show Volume Numbers
Turns the bid and ask numbers inside each footprint row on or off.
Leave this enabled when you want to read every price level precisely. Turn it off only when you want a cleaner visual view.
Volume Display Format
Chooses how volume text is written inside the row, for example separate bid and ask columns or a more compact combined format.
Use the separate layout when you need precise comparison. Use the compact format when screen space is limited.
Cell Alignment
Controls how the numbers are aligned inside each footprint row.
Alignment changes readability more than logic. Test left, center, or right alignment and keep the version that lets your eyes compare rows fastest.
Historical Footprints
Historical Footprints decides how much completed footprint history remains visible on the chart.

Show Historical Bars
Turns footprints on or off for completed candles.
When enabled you can review prior order flow. When disabled only the active candle keeps the footprint, which makes the chart lighter and cleaner.
Historical Bars Count
Sets the maximum number of completed candles that can display footprint data.
Increase this when you want more context for study. Reduce it if you want better performance or a less crowded chart.
Last Trade Marker
Last Trade Marker highlights the latest traded price on the active footprint candle and keeps the final level after the candle closes.

Show Last Trade Marker
Turns the marker on or off so the most recent traded price is easier to spot.
Keep it enabled when you want fast location of the live traded edge inside the active bar.
Last Trade Marker Color
Lets you choose the color used for the last traded price marker.
Pick a color that stands apart from value area, POC, and imbalance colors so it stays visible instantly.
2. Footprint Style
This section controls the footprint color language, text readability, imbalance styling, heatmap background, and reference highlights such as value area and Point of Control.
Theme & Text
Theme & Text controls the general color style and text readability of the footprint.
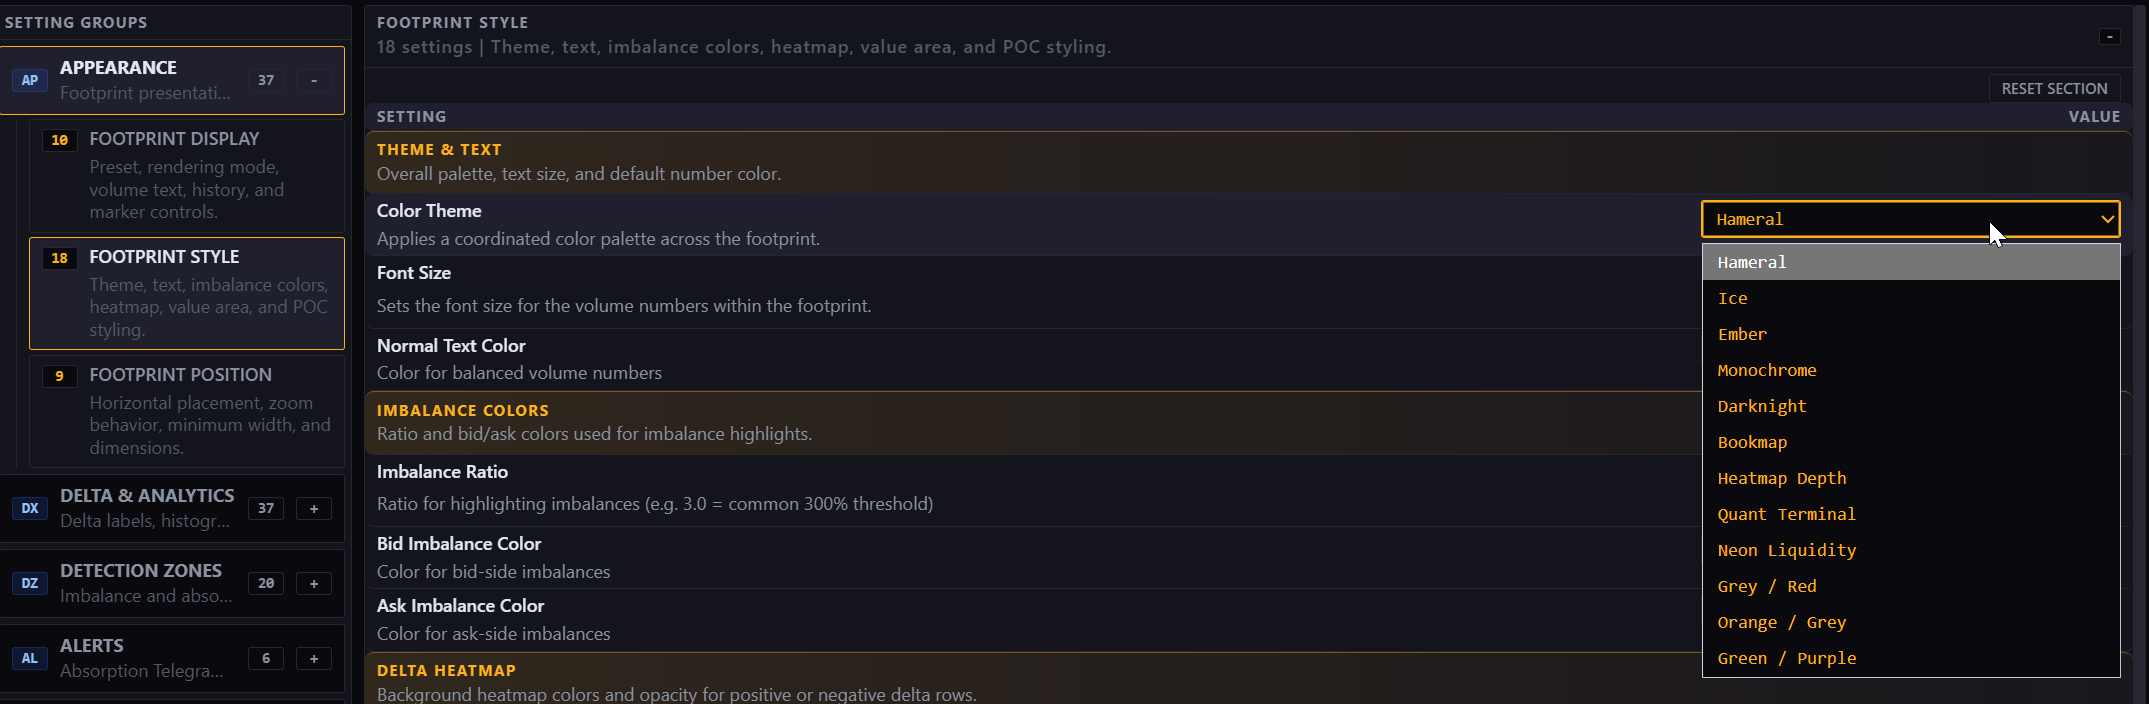
Color Theme
Applies a predefined palette across the footprint so you can change the full indicator look very quickly.
Choose a theme with stronger contrast if you trade fast, or a softer theme if you spend long sessions reading many rows.
- Available themes: Hameral, Ice, Ember, Monochrome, Darknight, Bookmap, Heatmap Depth, Quant Terminal, Neon Liquidity, Grey / Red, Orange / Grey, Green / Purple.

Font Size
Adjusts the size of the volume numbers inside the footprint rows.
Increase it when the rows feel cramped or you zoom out often. Reduce it only when you need to fit more rows inside narrow candles.
Normal Text Color
Sets the default color for balanced or neutral volume numbers.
Use a softer neutral color when you want imbalances and heatmaps to stand out more clearly.
Imbalance Colors
Imbalance Colors controls how strong bid-versus-ask differences are detected and highlighted inside the footprint.

Imbalance Ratio
Sets how much larger one side must be than the other before a row is treated as an imbalance.
A lower ratio finds more imbalances. A higher ratio is more selective and highlights only stronger pressure. A common starting point is 3.0.
Bid Imbalance Color
Sets the highlight color for bid-side imbalances.
Use a color you immediately associate with aggressive selling so the row meaning is obvious at a glance.
Ask Imbalance Color
Sets the highlight color for ask-side imbalances.
Use a color that clearly contrasts with bid imbalance color so buying pressure is not confused with selling pressure.
Delta Heatmap
Delta Heatmap colors the background of each price row based on buying or selling dominance.

Show Delta Heatmap Background
Turns the row background heatmap on or off.
Enable it when you want directional pressure to stand out even before reading the exact numbers.
Level Delta BG Bid Color (Sells)
Sets the background color for negative delta levels where selling dominates.
Choose a color that stays readable behind your text and does not hide imbalance markers.
Level Delta BG Ask Color (Buys)
Sets the background color for positive delta levels where buying dominates.
Use a strong but readable color so the positive side pops without washing out the numbers.
Level Delta Opacity
Controls how strong or transparent the heatmap background appears.
Raise it if the heatmap feels too weak. Lower it if the text becomes harder to read.
Value Area
Value Area highlights the rows where most of the candle volume traded.
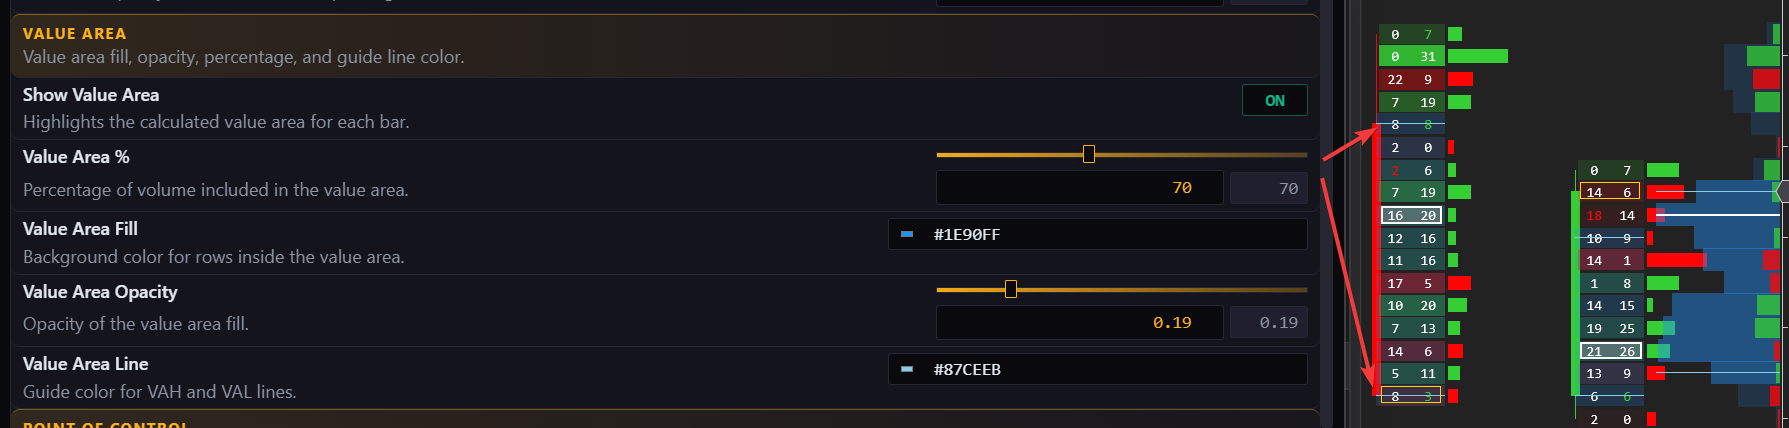
Show Value Area
Turns the value area highlight on or off for each bar.
Enable it when you want fast context for where the candle accepted the most business.
Value Area %
Sets how much of the candle volume is included in the value area.
For example, 70% highlights the area where 70% of the bar volume traded. Increase it for a wider accepted range and decrease it for a tighter core.
Value Area Fill
Sets the background color used for the rows inside the value area.
Choose a subtle fill so the area is visible without overpowering the number text.
Value Area Opacity
Controls how strong or transparent the value area background appears.
Use medium opacity if you want context without hiding the row data.
Value Area Line
Sets the guide color for the VAH and VAL reference lines.
Pick a line color that stays visible next to your theme and POC color.
Point of Control
Point of Control highlights the price level with the highest traded volume inside each footprint candle.
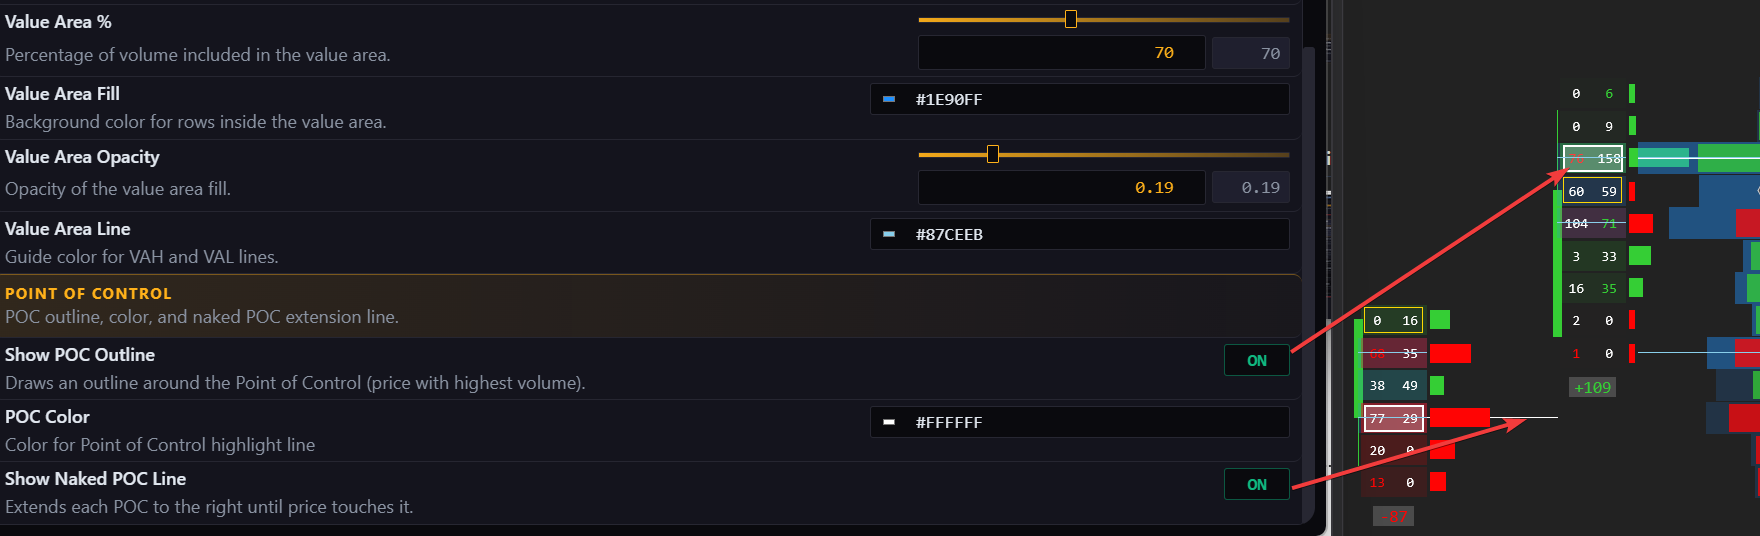
Show POC Outline
Turns the Point of Control highlight on or off inside the footprint.
Keep it enabled when you want the heaviest traded price of each bar to stand out immediately.
POC Color
Sets the color used for the Point of Control outline.
Choose a clear reference color that is not confused with value area or imbalance colors.
Show Naked POC Line
Extends the POC level to the right until price returns and touches it.
Use this when you want unfinished high-volume levels to remain visible as future references.
3. Footprint Position
This section controls where the footprint sits relative to the candle, how it reacts to zoom, and how wide and tall the footprint remains when the chart compresses.
Horizontal Placement
Horizontal Placement controls how far the footprint is offset from the candle body.
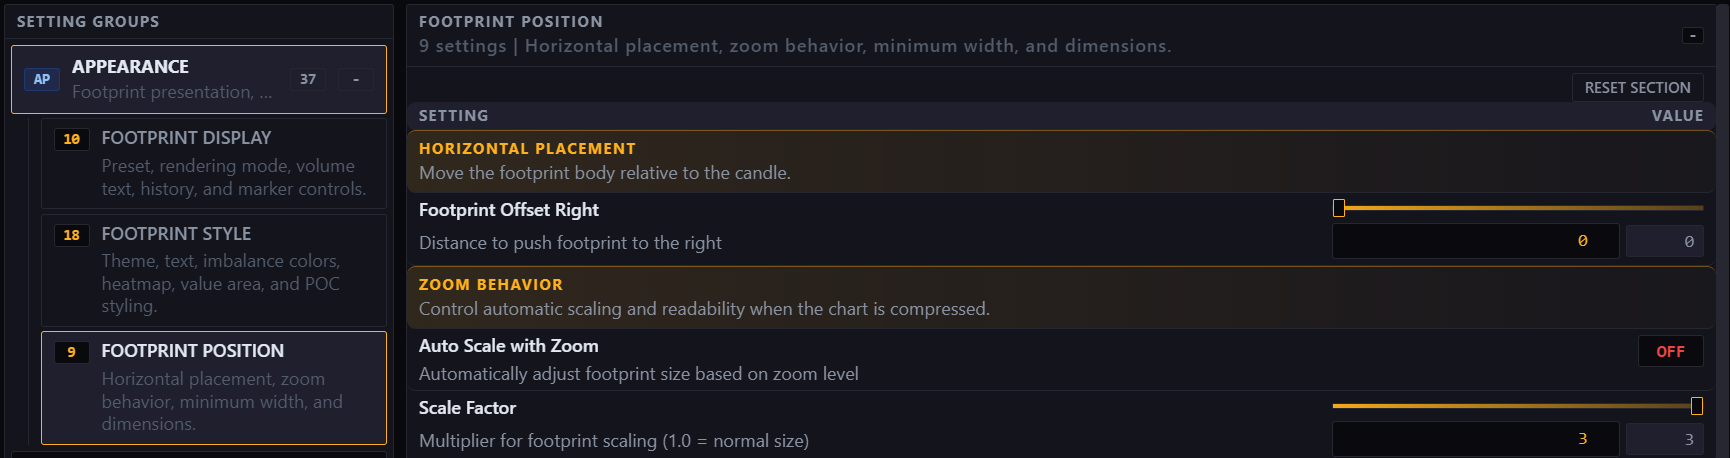
Footprint Offset Right
Moves the footprint farther to the right side of the candle.
Increase this if the candle body feels too close to the numbers or if you need more room for histograms.
Zoom Behavior
Zoom Behavior controls how the footprint grows, shrinks, or hides itself when the chart zoom changes.
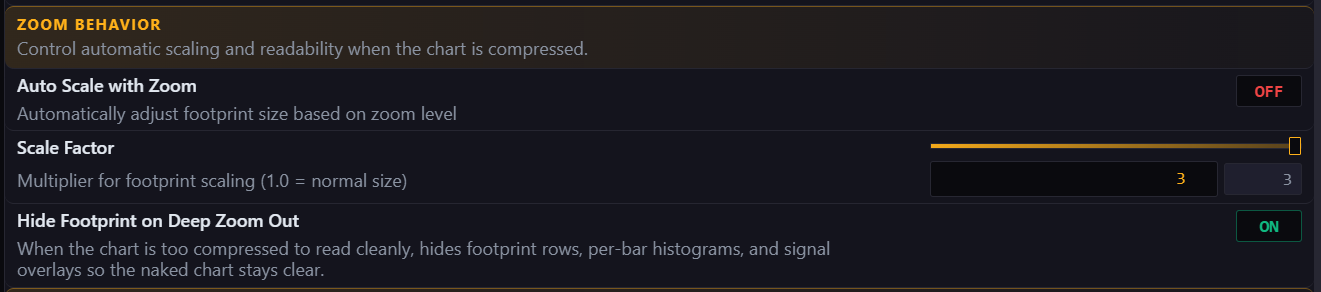
Auto Scale with Zoom
Automatically adjusts the footprint size based on the chart zoom level.
Keep this enabled if you zoom in and out often and want the footprint to stay proportionate.
Scale Factor
Controls the overall footprint size multiplier.
Increase it if the footprint looks too small. Reduce it if the footprint feels oversized relative to the candles.
Hide Footprint on Deep Zoom Out
Hides footprint rows, histograms, and signal overlays when the chart is too compressed to read clearly.
This keeps the chart clean when zoomed far out and avoids unreadable noise.
Minimum Width
Minimum Width keeps the footprint readable even when candles become very narrow.
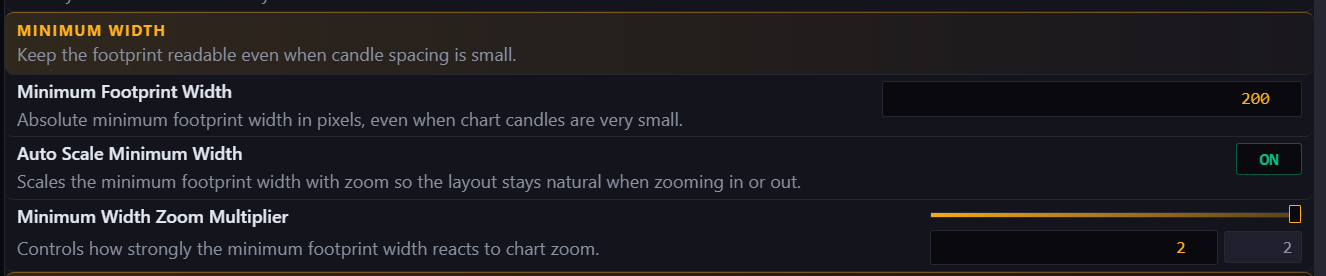
Minimum Footprint Width
Sets the minimum footprint width so the rows never become too narrow to read.
Raise it when the footprint collapses too much on compressed charts.
Auto Scale Minimum Width
Lets the minimum width react to zoom so the footprint keeps a more natural size while scaling.
Use this when you want smoother behavior across different zoom levels.
Minimum Width Zoom Multiplier
Controls how strongly the minimum width reacts to zoom changes.
Increase it if the footprint still becomes too tight when zoomed out. Lower it if it grows too aggressively.
Footprint Dimensions
Footprint Dimensions controls the final width and row height scaling of the footprint body.

Footprint Width Multiplier
Adjusts the width of the footprint body independently from the candle size.
Increase it when the footprint needs more breathing room for numbers and inline elements.
Row Height Multiplier
Adjusts the vertical spacing between footprint rows.
Increase it if the rows feel compressed or difficult to read, especially on high-volatility instruments.
4. Delta & Analytics
This section controls candle delta labels, histogram appearance, and the bottom analytics panel so you can decide how much directional and statistical information stays visible.
Visible Values
Visible Values controls which candle totals are shown under each footprint candle.

Show Candle Delta
Displays the total delta under each candle so you can see the final buying-versus-selling result of the bar.
Enable this if you want quick directional context without opening the full panel.
Show Bid/Ask Totals
Displays the total bid volume and total ask volume above the candle delta label.
This is useful when you want both the final delta and the raw participation of each side.
Placement & Size
Placement & Size controls where the candle totals block sits and how readable it is.
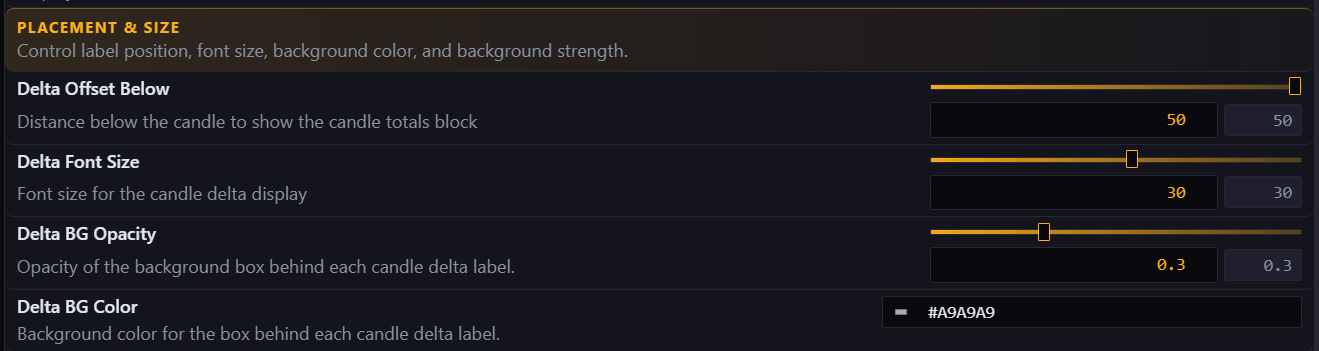
Delta Offset Below
Sets how far below the candle the candle totals block is drawn.
Increase it if the totals overlap the candle or other chart elements.
Delta Font Size
Controls the font size used for the candle delta display.
Increase it when you want the bar result to stand out faster.
Delta BG Opacity
Controls how solid or transparent the background behind the candle totals appears.
Use more opacity when the chart background is busy. Use less when you want a lighter look.
Delta BG Color
Sets the background color for the candle totals box.
Pick a neutral tone that supports readability without competing with positive and negative delta colors.
Direction Colors
Direction Colors controls the colors used for positive, negative, and neutral candle delta values.
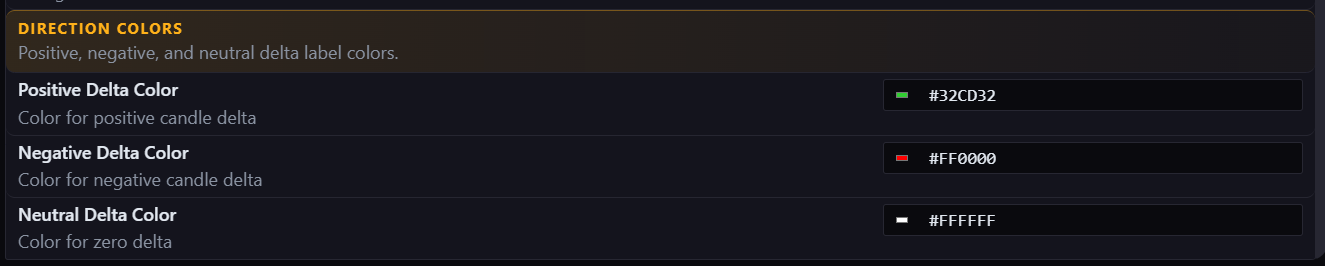
Positive Delta Color
Sets the color used when candle delta finishes positive.
Choose a strong buy-side color that is easy to distinguish quickly.
Negative Delta Color
Sets the color used when candle delta finishes negative.
Use a clear sell-side color that stands apart from positive delta immediately.
Neutral Delta Color
Sets the color used when candle delta finishes near zero or neutral.
A softer neutral color works well so only meaningful directional bars dominate your attention.
Histogram Layout
Histogram Layout controls the size and placement of the histogram lanes around the footprint.
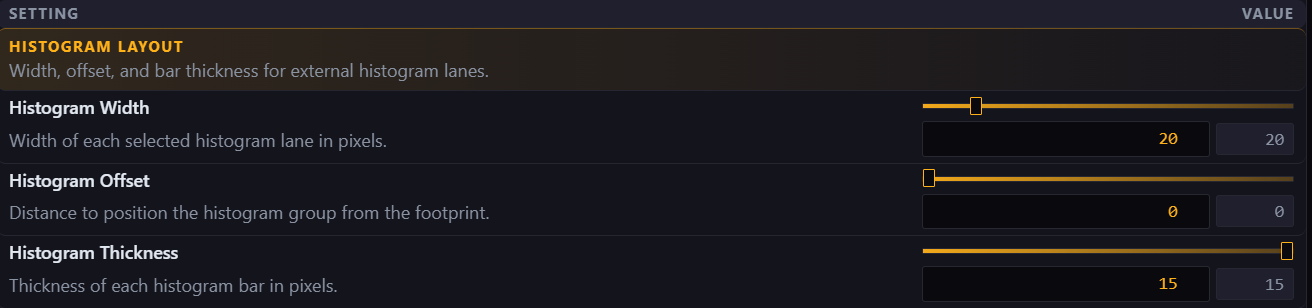
Histogram Width
Sets the width of each selected histogram lane in pixels.
Increase it when the histogram feels too thin to compare bar-to-bar.
Histogram Offset
Controls the distance between the footprint body and the histogram group.
Raise it when the histogram feels visually crowded against the footprint.
Histogram Thickness
Sets the thickness of each histogram bar.
Increase it for stronger visual emphasis. Reduce it when you want a lighter, more compact lane.
Delta Histogram Colors
Delta Histogram Colors controls the colors used by positive and negative delta histogram bars.

Delta Positive Color
Sets the color for positive delta histogram bars.
Match this to your positive delta palette for consistency.
Delta Negative Color
Sets the color for negative delta histogram bars.
Keep strong contrast between positive and negative bars so directional shifts are obvious.
Panel Visibility
Panel Visibility controls whether the bottom analytics panel is shown under the footprint.
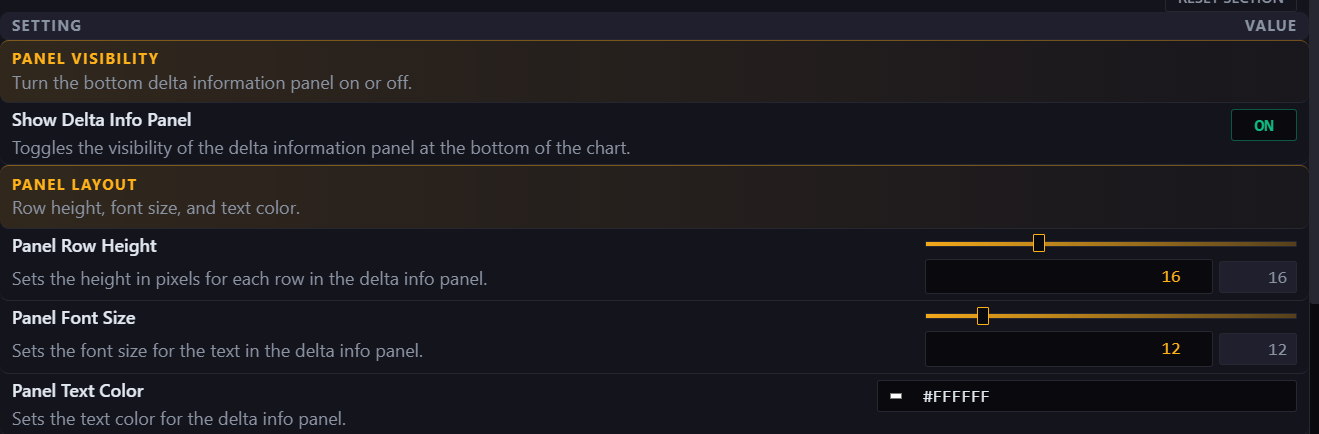
Show Delta Info Panel
Turns the bottom analytics panel on or off.
Enable it when you want extra delta, volume, and order-flow statistics for each candle. Disable it for a cleaner footprint-only view.
Panel Layout
Panel Layout controls the spacing, size, and readability of the Delta Info Panel rows.
Panel Row Height
Sets the height of each analytics row in the panel.
Increase it if the panel feels cramped or hard to scan quickly.
Panel Font Size
Controls the text size used inside the analytics panel.
Raise it if you keep the panel visible during live trading.
Panel Text Color
Sets the default text color used across the panel.
Choose a readable neutral color that still lets heatmap backgrounds stand out.
Cell Separators
Cell Separators controls the horizontal guide lines between rows in the analytics panel.
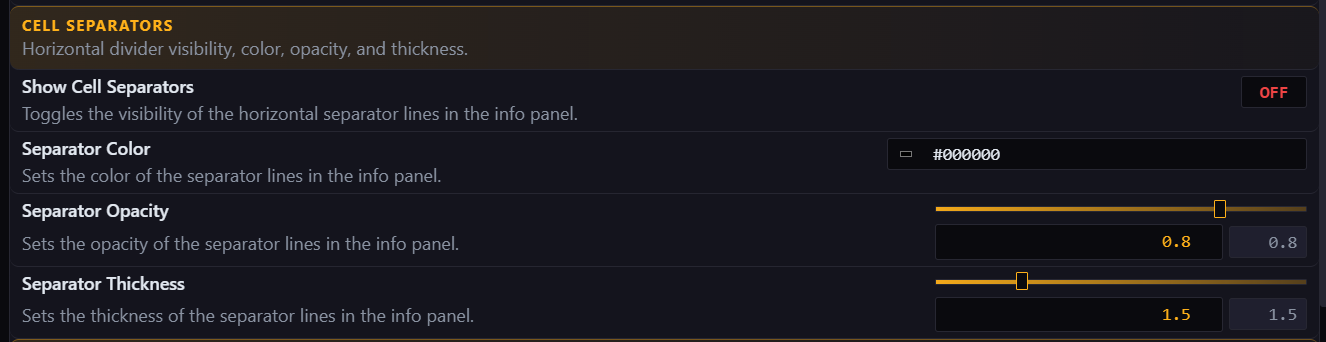
Show Cell Separators
Turns the panel separator lines on or off.
Enable them if you want cleaner row separation in larger panels.
Separator Color
Sets the color of the separator lines.
Use a subtle contrast color so the lines organize the panel without overpowering it.
Separator Opacity
Controls how visible the separator lines are.
Lower it for a softer look. Raise it for clearer row division.
Separator Thickness
Controls how thick each separator line appears.
Increase it only if the panel still feels visually crowded.
Core Rows
Core Rows controls the main delta and volume statistics shown inside the panel.
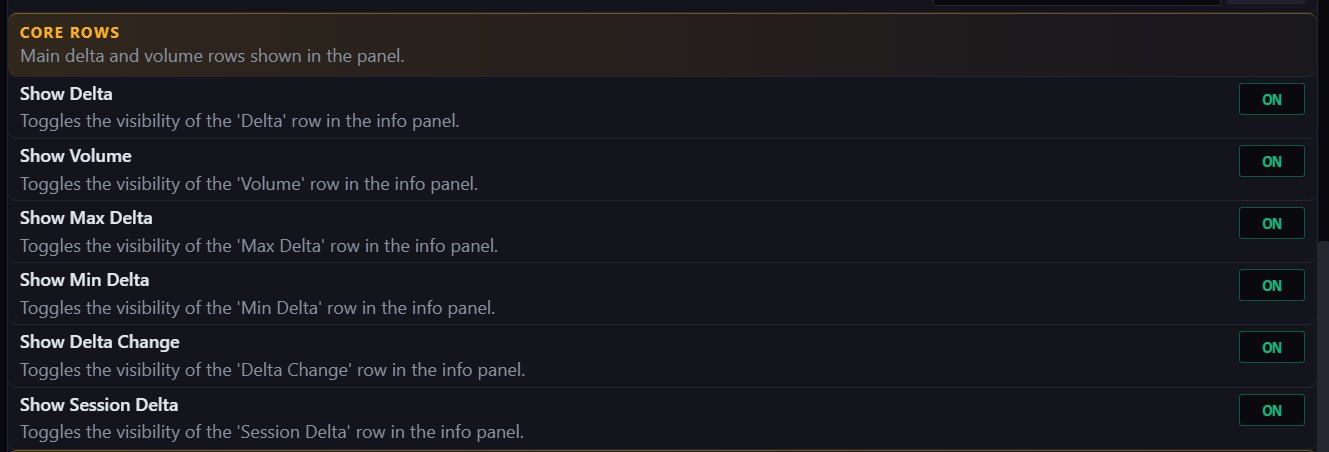
Show Delta
Shows or hides the Delta row in the panel.
Enable this when you want the core directional result always visible.
Show Volume
Shows or hides the Volume row in the panel.
Useful when total participation matters as much as direction.
Show Max Delta
Shows or hides the Max Delta row.
This helps identify the strongest positive pressure reached during the bar.
Show Min Delta
Shows or hides the Min Delta row.
This helps identify the strongest negative pressure reached during the bar.
Show Delta Change
Shows or hides the Delta Change row.
Useful when you want to track how the bar finished versus how it developed.
Show Session Delta
Shows or hides the Session Delta row.
Keep this visible when you want bar reading tied to the larger session flow.
Advanced Rows
Advanced Rows controls extra analytics that add more context without changing the core footprint.
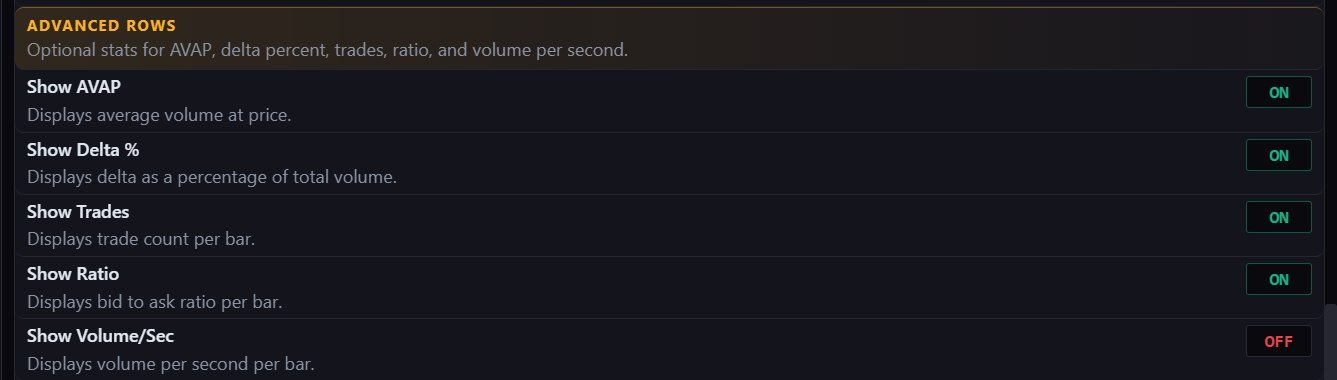
Show AVAP
Shows or hides AVAP in the panel.
Use it when average activity at price helps your reading.
Show Delta %
Shows or hides delta as a percentage of total volume.
Useful when you want normalized delta, not just raw size.
Show Trades
Shows or hides the trade count row.
Helpful when you want to compare the number of executions, not just their size.
Show Ratio
Shows or hides the ratio row.
Useful when you want a quick pressure comparison between the two sides.
Show Volume/Sec
Shows or hides the volume-per-second row.
This helps spot acceleration and pace changes inside active bars.
Heatmap Backgrounds
Heatmap Backgrounds controls the background colors used by the analytics panel.
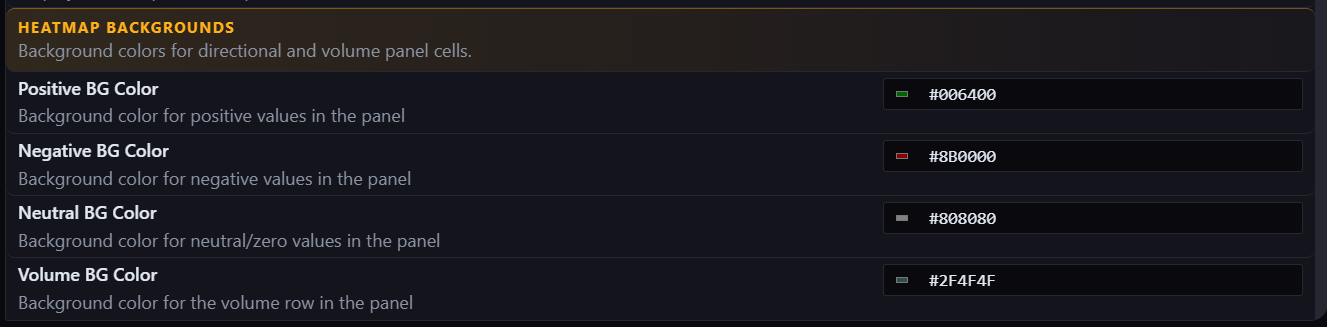
Positive BG Color
Sets the panel background color for positive values.
Use a readable positive tone that supports the text.
Negative BG Color
Sets the panel background color for negative values.
Choose a negative tone that contrasts clearly with positive values.
Neutral BG Color
Sets the panel background color for neutral values.
A softer neutral helps zero or balanced readings fade into the background.
Volume BG Color
Sets the panel background color for volume rows.
Use a distinct but calm color so volume context stays readable.
5. Detection Zones
This section controls how imbalance and absorption zones are detected, highlighted, drawn on the chart, and kept visible as support or resistance references.
Zone Detection
Zone Detection controls how stacked imbalance zones are detected and drawn on the chart.
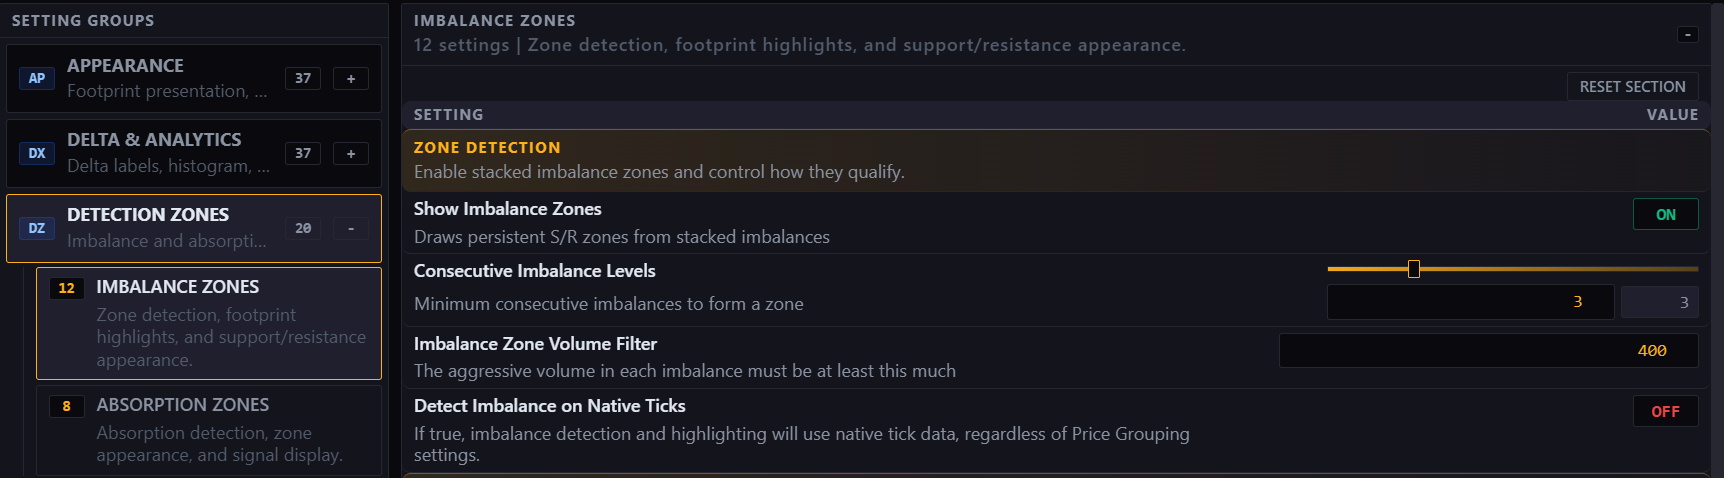
Show Imbalance Zones
Turns persistent support and resistance zones from stacked imbalances on or off.
Enable this if you want strong imbalance areas to remain visible after the footprint bar is complete.
Consecutive Imbalance Levels
Sets how many imbalance levels must appear in a row before a zone is created.
Lower values create more zones. Higher values are stricter and mark only stronger stacked pressure.
Imbalance Zone Volume Filter
Sets the minimum aggressive volume required for each imbalance level to qualify.
Raise this when you want to ignore weaker activity and keep only more meaningful zones.
Detect Imbalance on Native Ticks
Uses native tick data for imbalance detection even when price grouping is enabled.
This gives more precise detection when grouped rows would otherwise smooth the raw imbalance detail.
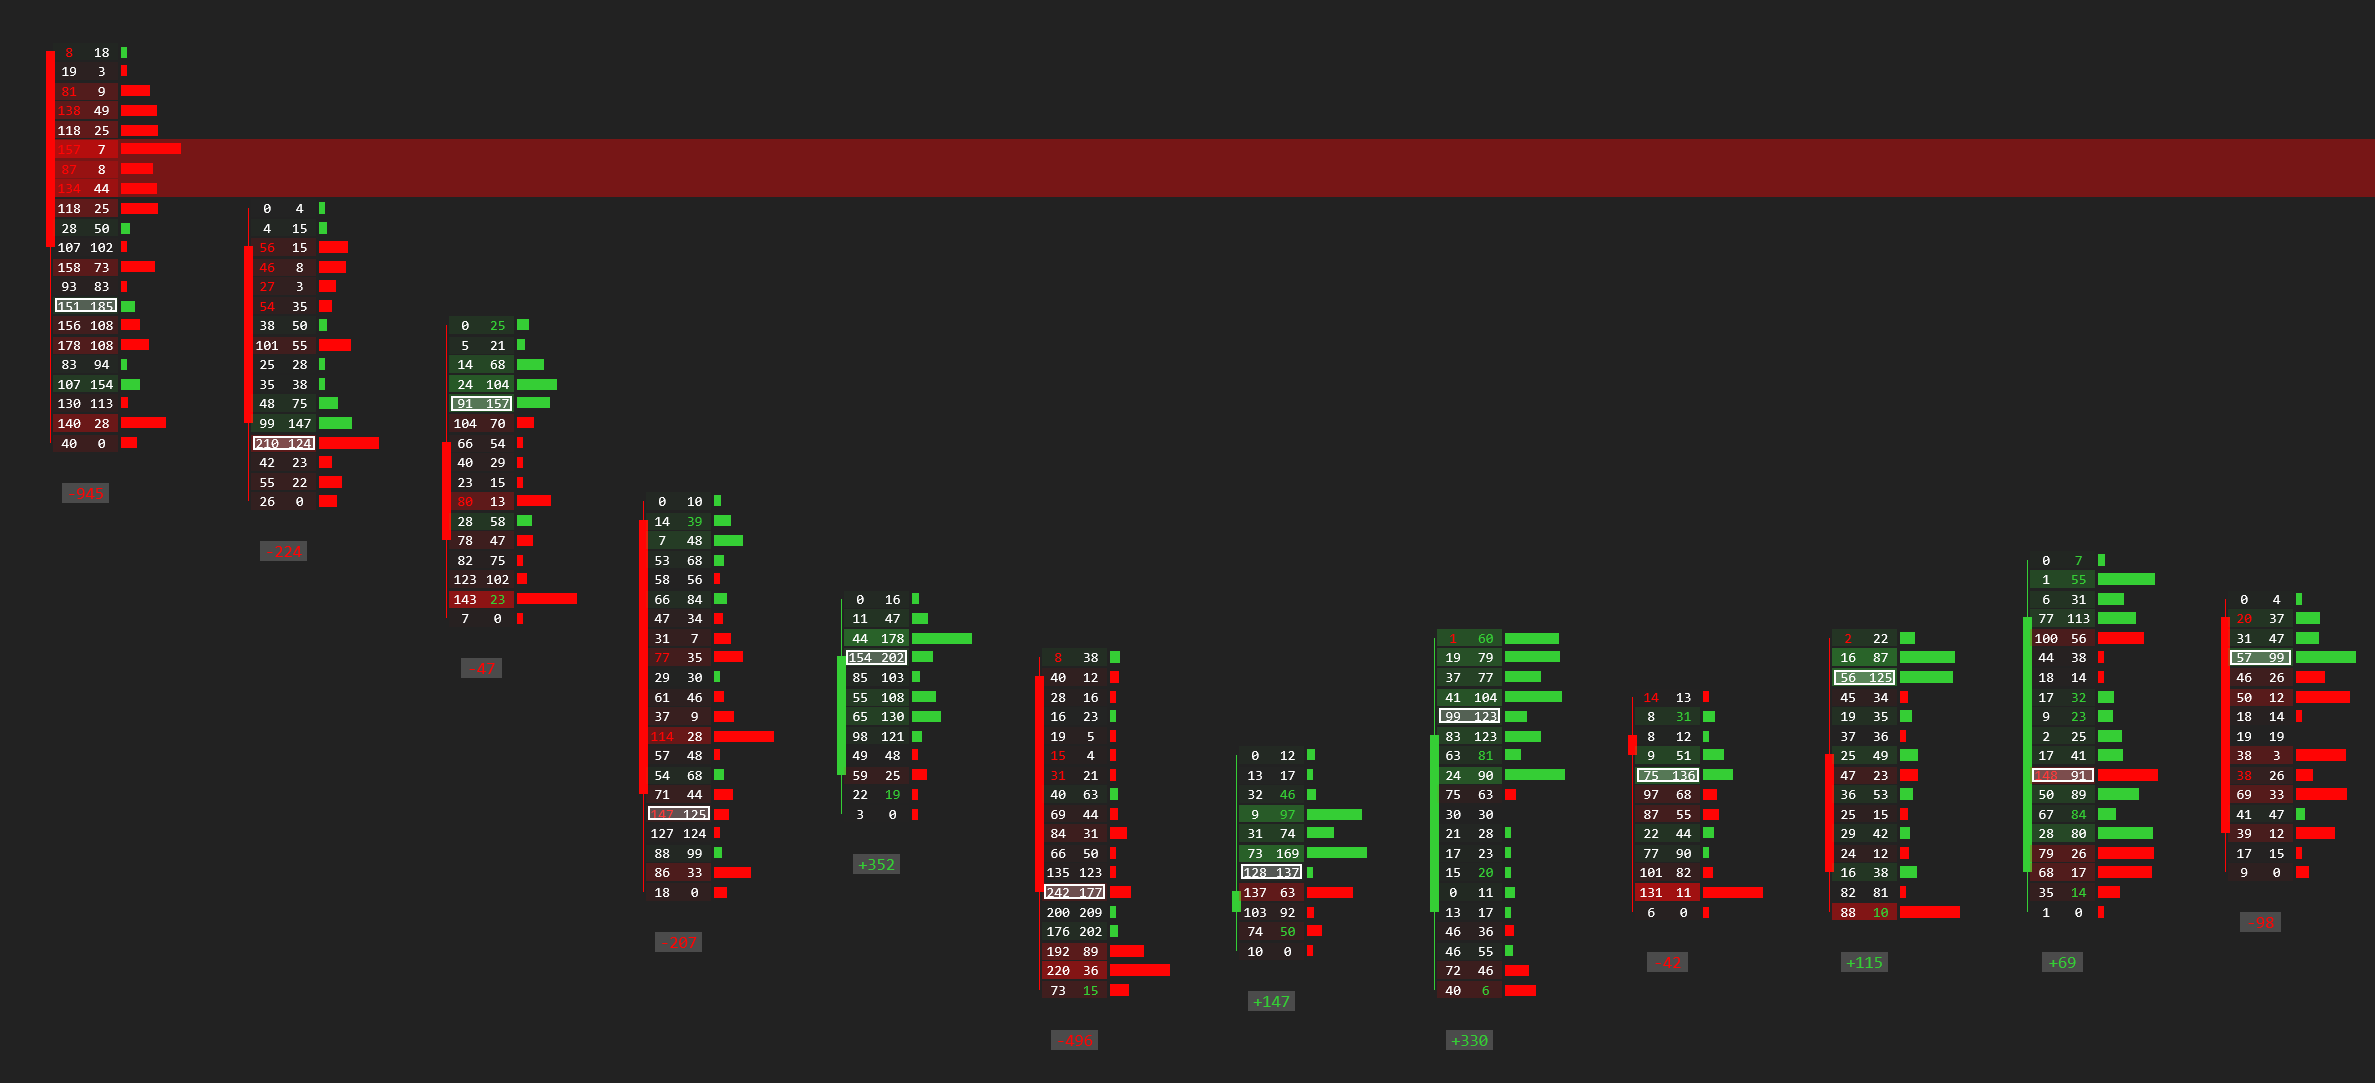
A practical example is 3 consecutive levels with more than 70 contracts of imbalance. This creates a zone only after both the sequence and the volume filter agree.
Footprint Highlights
Footprint Highlights controls the inline highlights for stacked imbalance runs inside the footprint rows.
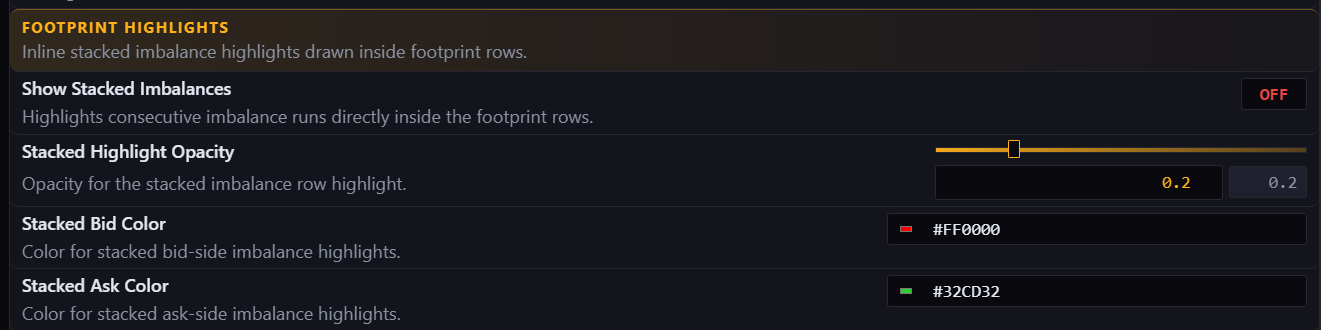
Show Stacked Imbalances
Turns stacked imbalance highlights on or off inside the footprint.
Enable it when you want the stacked run to stand out before looking at the chart zone.
Stacked Highlight Opacity
Controls how strong or transparent the stacked highlight appears.
Increase it if the stacked run still feels too subtle.
Stacked Bid Color
Sets the color for stacked bid-side highlights, usually tied to stronger selling pressure.
Use a color that matches your sell-side logic.
Stacked Ask Color
Sets the color for stacked ask-side highlights, usually tied to stronger buying pressure.
Use a color that matches your buy-side logic.
Zone Appearance
Zone Appearance controls the colors, opacity, and stop behavior of imbalance support and resistance zones.
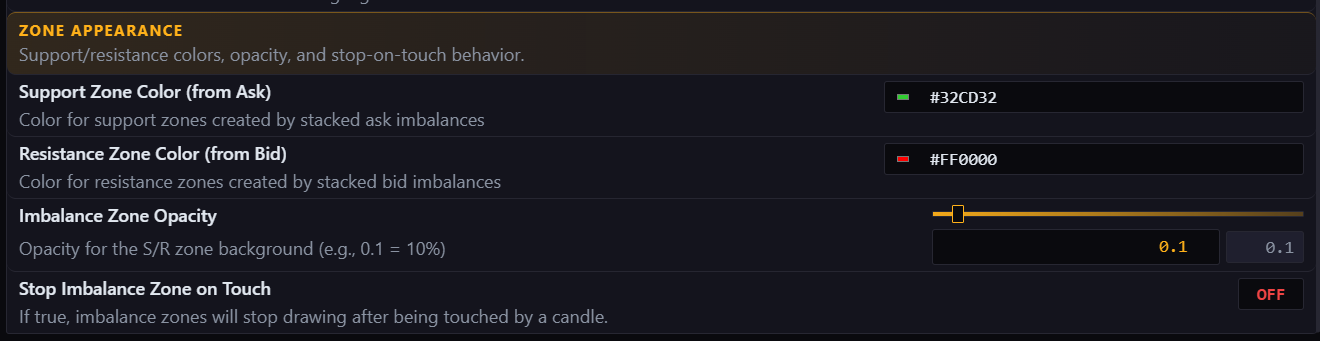
Support Zone Color (from Ask)
Sets the color for support zones created by stacked ask imbalances.
Pick a support color that stays clear across your theme.
Resistance Zone Color (from Bid)
Sets the color for resistance zones created by stacked bid imbalances.
Choose a resistance color that is easy to distinguish from support.
Imbalance Zone Opacity
Controls how strong or transparent the zone background appears.
Lower opacity works well when you expect many zones on the chart.
Stop Imbalance Zone on Touch
Stops drawing the zone after price touches it with a candle.
Enable this if you want only untouched zones to remain active.
Absorption Zone Detection
Absorption Zone Detection confirms absorption with native tick resolution and compares aggressive volume at the candle high or low against the opposite side nearby.
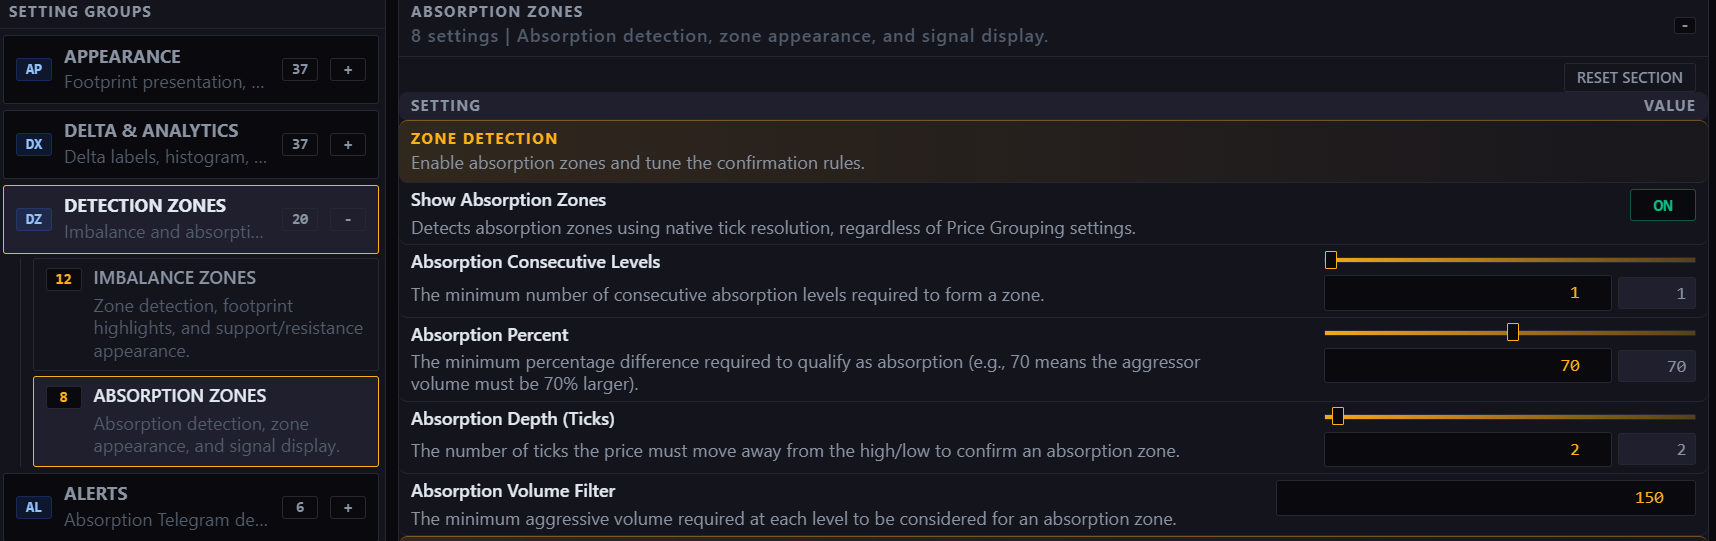
Show Absorption Zones
Turns absorption zone detection on or off.
Enable it when you want strong passive absorption at highs or lows to remain visible as a future level.
Absorption Consecutive Levels
Sets how many consecutive absorption levels are needed before a zone can be created.
Lower values produce more signals. Higher values demand stronger repeated absorption.
Absorption Percent
Sets how much stronger the aggressive volume must be than the opposite side.
Increase it when you want only clearer absorption imbalances. Lower it when you want more frequent but less selective signals.
Absorption Depth (Ticks)
Confirms the zone only if price moves away from the high or low by the selected number of ticks.
Use a larger value when you want stronger proof that price actually rejected from the level.
Absorption Volume Filter
Sets the minimum aggressive volume required at each level before it can qualify.
Raise it to filter out weaker extremes and keep only more meaningful absorption.
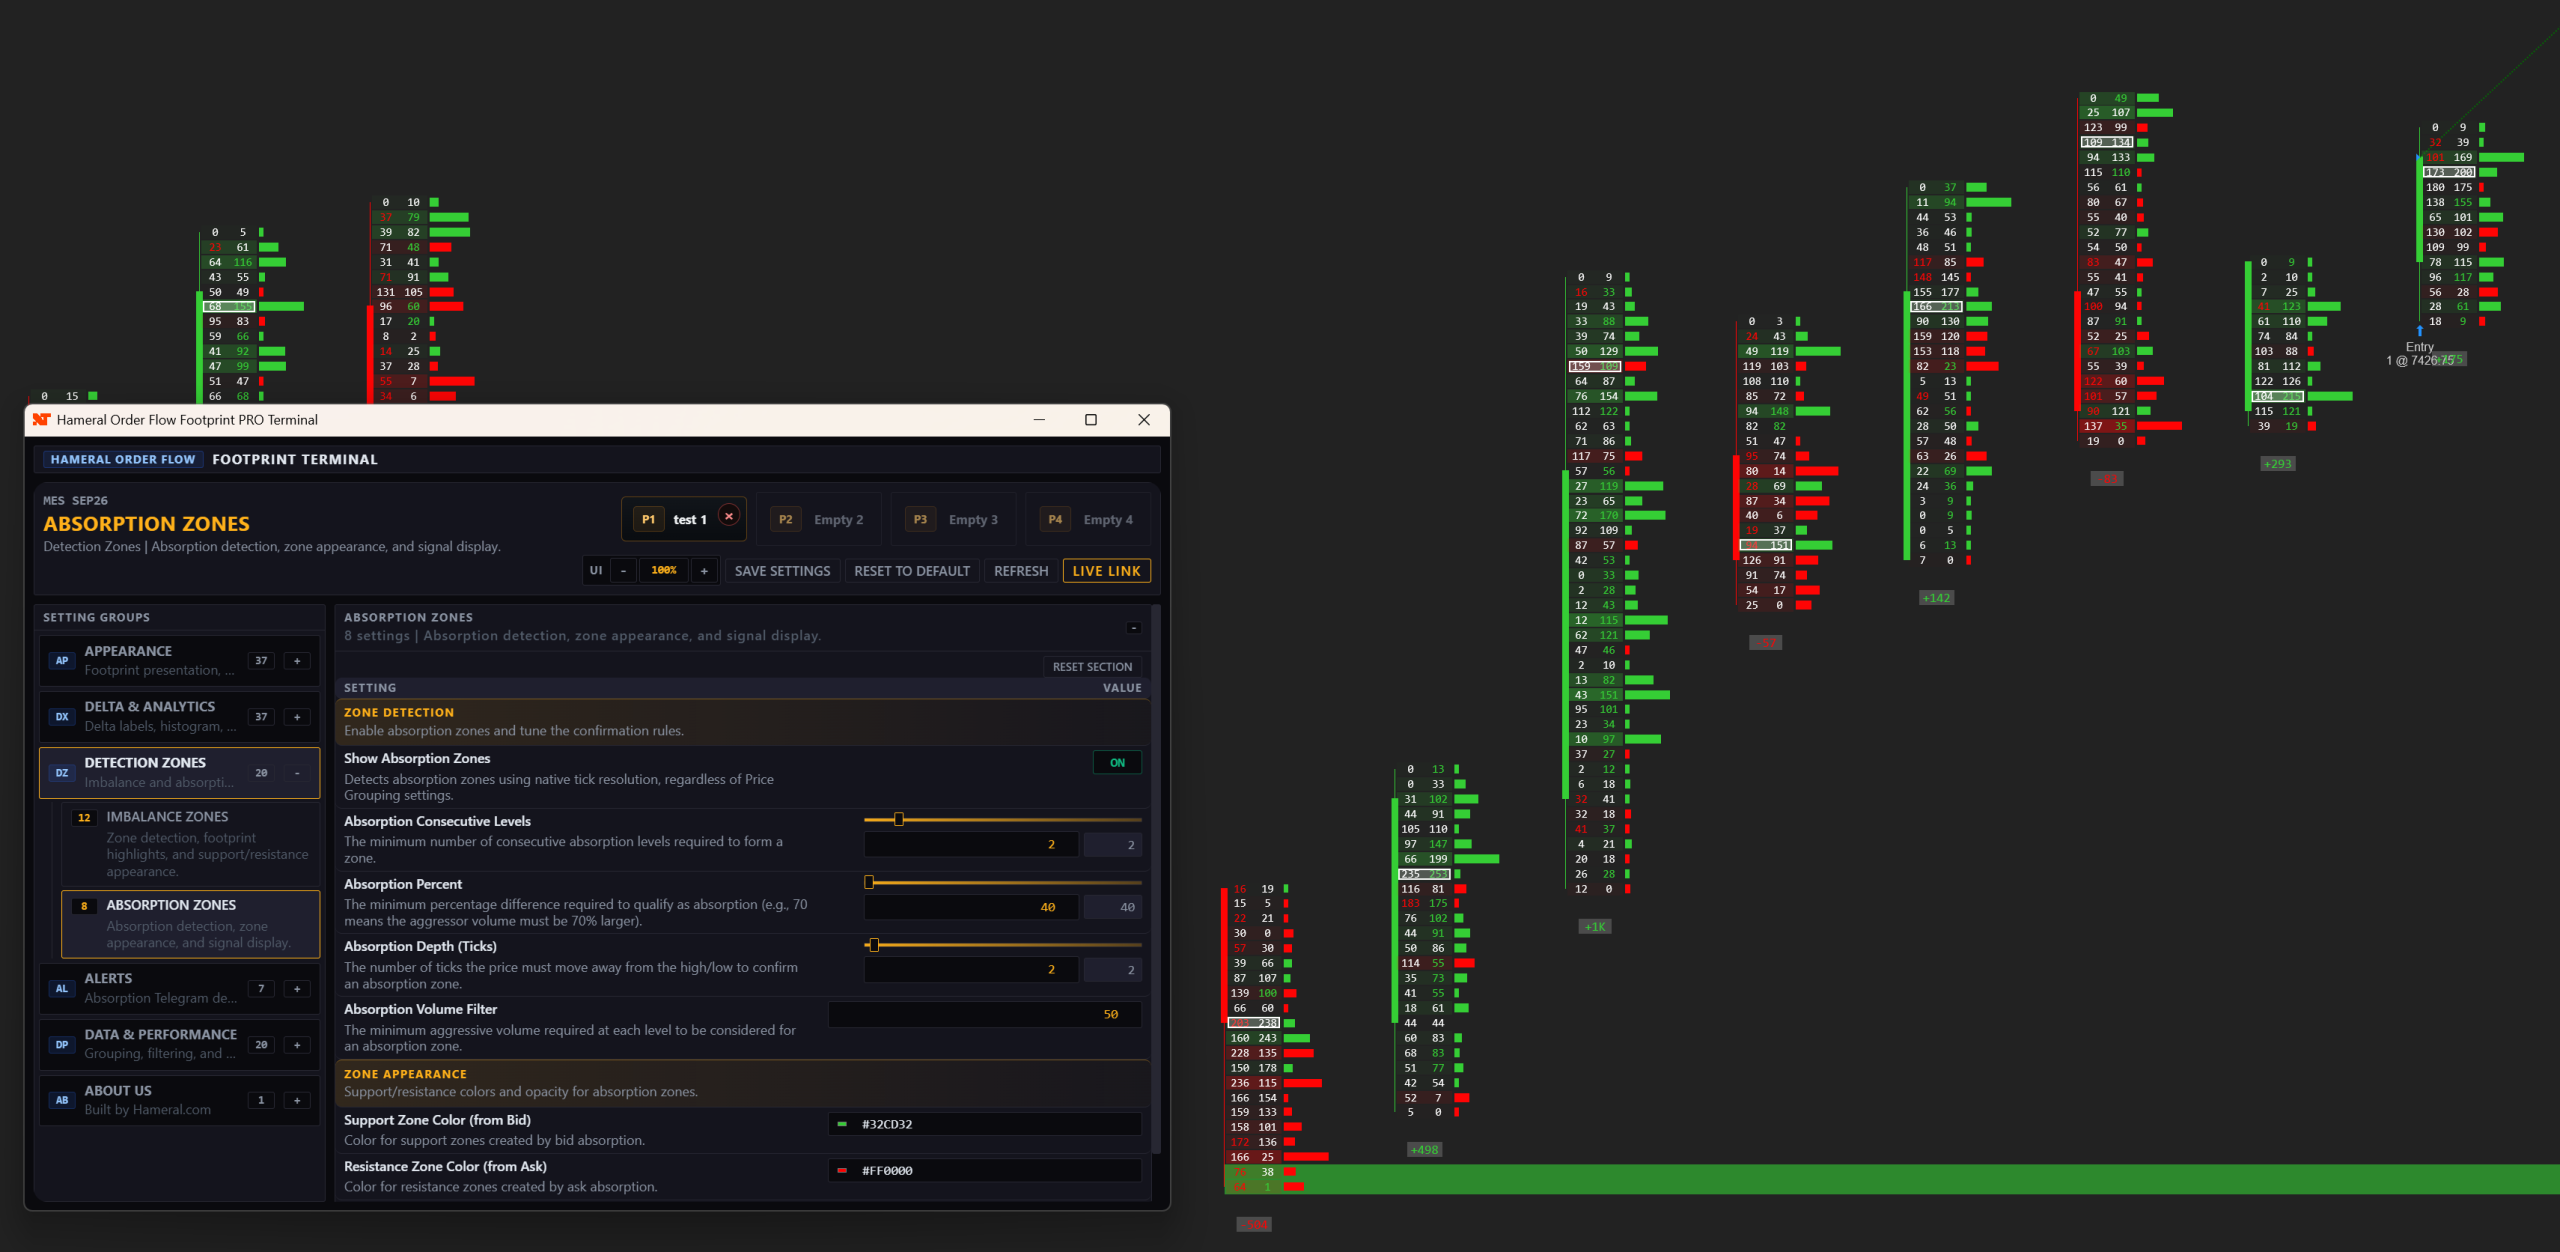
If Absorption Percent is 50, Absorption Volume Filter is 50, and Absorption Consecutive Levels is 2, the indicator looks for two consecutive rows with at least 50 contracts and at least 50 percent stronger aggressive volume before confirming the zone after price moves away by the selected depth.
Absorption Zone Appearance
Absorption Zone Appearance controls the support, resistance, and opacity styling used for absorption zones.
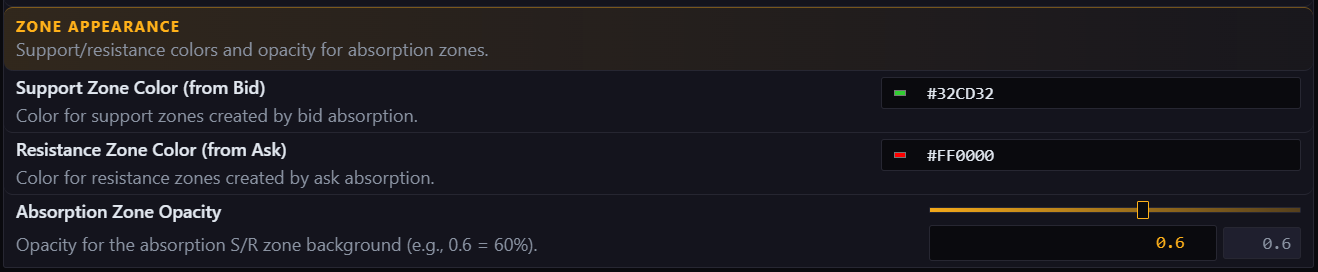
Support Zone Color (from Bid)
Sets the color for support zones created by bid absorption.
Use a stable support color that fits the rest of your chart.
Resistance Zone Color (from Ask)
Sets the color for resistance zones created by ask absorption.
Use a resistance color that does not conflict with imbalance resistance.
Absorption Zone Opacity
Controls how strong or transparent the absorption zone background appears.
Reduce it if you want zones visible but less intrusive.
6. Alerts
This section controls how absorption alerts are delivered, how Telegram is connected, and how the final signal message is formatted.
Delivery Channels
Delivery Channels controls where absorption alerts are sent.

Enable Telegram Alerts
Sends Telegram notifications when absorption signals are detected.
Enable this when you want mobile or remote notification delivery.
Enable NinjaTrader Alerts
Plays the selected NinjaTrader alert when absorption signals are detected.
Use this when you want local platform sound alerts while actively watching the chart.
Telegram Connection
Telegram Connection stores the bot credentials needed to send absorption alerts to Telegram.

Telegram Bot Token
Enter the API token from your Telegram bot so the indicator can send messages through it.
Paste the token exactly as created by BotFather.
Telegram Chat ID
Enter the personal or group chat ID where Telegram alerts should be delivered.
Use the correct chat ID for the final destination or the alerts will not arrive.
Watch the full video walkthrough for connecting the Telegram bot here: https://www.youtube.com/watch?v=oFzw1hdefUw
Message & Timing
Message & Timing controls the alert message format and whether the signal waits for bar-close confirmation.
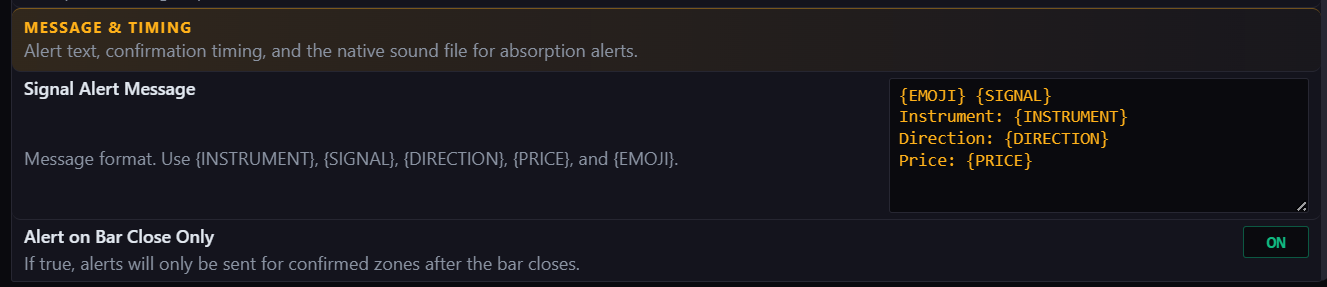
Signal Alert Message
Lets you customize the text used in the alert notification.
Keep the message short and information-rich so the alert is readable immediately on desktop and mobile.
- Available placeholders: {INSTRUMENT}, {SIGNAL}, {DIRECTION}, {PRICE}, {EMOJI}.
Alert on Bar Close Only
Sends alerts only after the bar closes and the absorption zone is confirmed.
Enable this for more confirmation. Disable it only if you prefer earlier but less confirmed intrabar alerts.
7. Data & Performance
This section controls price grouping, summary profile behavior, filtering logic, and performance limits so you can balance clarity, selectivity, and chart speed.
Price Profile
Price Profile controls price grouping, the right-side summary profile, and previous-session reference levels.
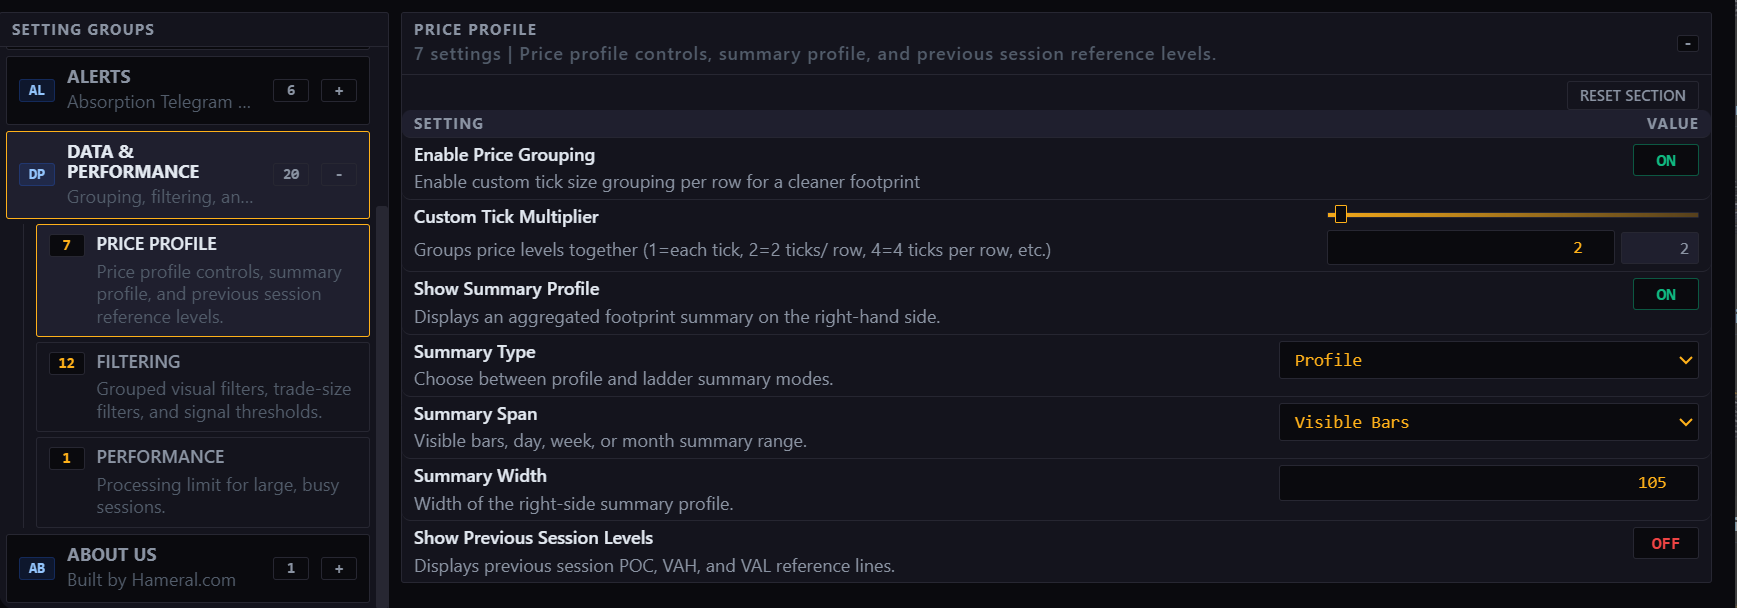
Enable Price Grouping
Turns custom tick grouping on or off so multiple price levels can be combined into one cleaner row.
Enable grouping when you want a smoother footprint with fewer rows.
Custom Tick Multiplier
Sets how many ticks are grouped into one footprint row.
Increase it for a cleaner aggregated view. Reduce it when you want more raw detail.
Show Summary Profile
Displays an aggregated summary profile on the right side of the chart.
Useful when you want broader context beside the individual footprint bars.
Summary Type
Chooses between Profile and Ladder summary modes.
Profile is better for shape reading. Ladder can feel closer to footprint logic.
Summary Span
Selects the range used by the summary profile, such as visible bars, day, week, or month.
Choose a shorter span for local context and a longer span for broader auction reference.
Summary Width
Controls the width of the right-side summary profile.
Increase it if the summary becomes too compressed to read clearly.
Show Previous Session Levels
Displays previous-session POC, VAH, and VAL as chart references.
Enable this when prior-session acceptance and rejection levels matter in your plan.
Display Behavior
Display Behavior controls how zero values are shown inside the footprint.
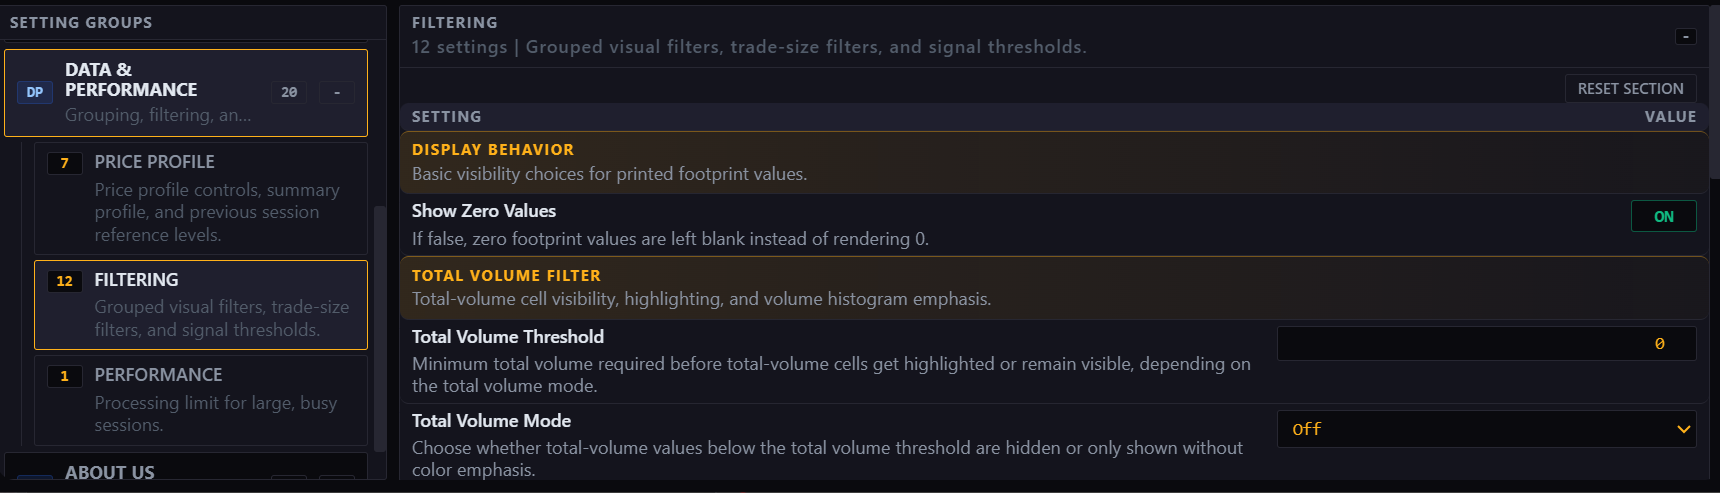
Show Zero Values
Shows or hides zero values inside the footprint rows.
When disabled, zero values are left blank for a cleaner view and faster visual scanning.
Total Volume Filter
Total Volume Filter controls when total-volume values stay visible, get hidden, or become highlighted.
Total Volume Threshold
Sets the minimum total volume required before a level is highlighted or remains visible.
Raise it to focus only on more meaningful participation.
Total Volume Mode
Controls how values below the threshold are treated.
Depending on the mode, lower-volume rows can stay normal, be hidden, or only appear when they pass the condition.
Bid / Ask Filters
Bid / Ask Filters gives separate visibility and highlight thresholds to bid-side and ask-side values.
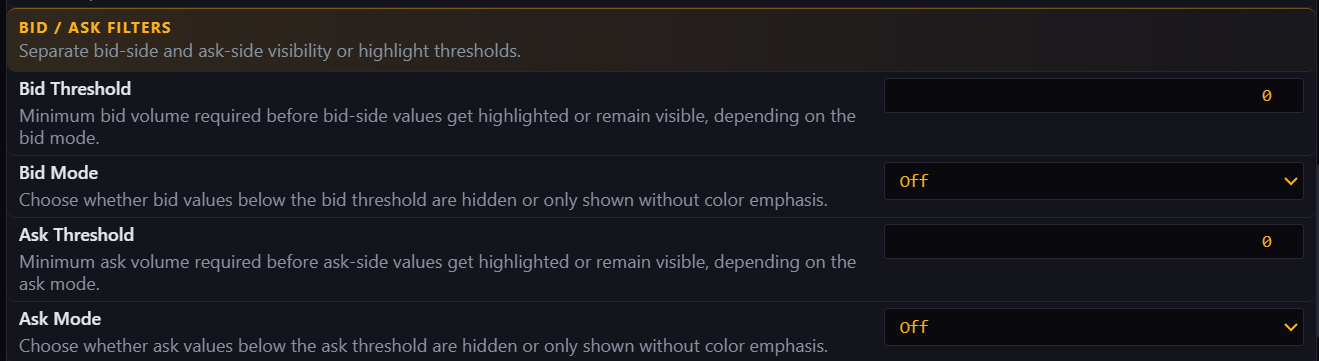
Bid Threshold
Sets the minimum bid volume required before bid-side values remain visible or highlighted.
Raise it when you want to ignore lighter sell-side prints.
Bid Mode
Controls how bid values below the threshold are treated.
Use the mode that best matches whether you want hidden, normal, or selectively highlighted values.
Ask Threshold
Sets the minimum ask volume required before ask-side values remain visible or highlighted.
Raise it when you want to focus only on stronger buy-side participation.
Ask Mode
Controls how ask values below the threshold are treated.
This helps you decide whether weaker ask values should stay visible or disappear.
Delta Filter
Delta Filter controls when delta values, delta heatmaps, and delta histograms remain visible or highlighted.

Delta Threshold
Sets the minimum absolute delta required before delta values are highlighted or remain visible.
Raise it to focus only on stronger directional imbalance.
Delta Mode
Controls how delta values below the threshold are treated.
Use a stricter mode if you want the footprint to emphasize only stronger directional rows.
Trade Size Filter
Trade Size Filter tracks filtered totals based on the size of each individual trade.

Use Trade Size Filter
Turns the trade-size filter on or off so only trades inside the selected size range are counted.
Enable it when you want to isolate a specific participant size, such as larger prints.
Min Trade Size
Sets the smallest trade size included in the filtered totals.
Increase it when you want to ignore smaller executions.
Max Trade Size
Sets the largest trade size included in the filtered totals.
Lower it when you want to exclude oversized prints and study only a defined trade-size band.
Processing Limit
Processing Limit controls how many price levels are processed inside each footprint candle.
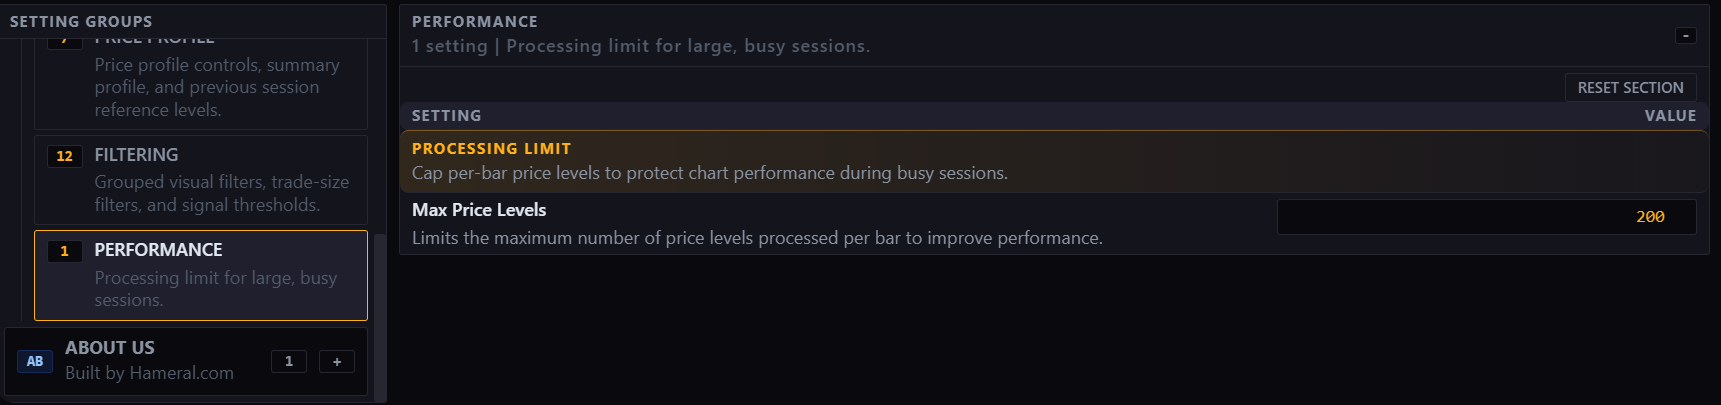
Max Price Levels
Sets the maximum number of price levels processed per bar to protect chart performance during large or busy candles.
Lower it if the chart becomes heavy. Raise it only when you need deeper bar coverage.
8. About Us
This section provides direct Hameral reference links so the user can quickly reach the website, the shop, and support contact details from inside the terminal.
About Us
About Us provides basic Hameral information and quick access to the website, shop, and support email.
Website
Opens the main Hameral website where you can learn more about the tools and resources.
Use this for product information, updates, and official references.
Shop
Opens the Hameral shop where you can discover more professional and free NinjaTrader indicators.
Useful when you want related tools or add-ons from the same ecosystem.
Contact Email
Shows the support email you can use if you need help with the indicator or your license.
Use this when the issue needs direct assistance from Hameral.
Complete Terminal Summary
Quick reference for all 123 Footprint PRO terminal functions. Use this table when you want to scan the full terminal before fine-tuning a chart.
| Terminal Group | Subcategory | Setting | What It Controls |
|---|---|---|---|
| Footprint Display | Layout Preset | Display Template | Loads a complete visual preset so the footprint starts with a proven combination of display, histogram, analytics, and style settings. |
| Footprint Display | Footprint Mode | Imprint Mode | Changes the core reading style of each price row inside the footprint candle. |
| Footprint Display | Footprint Mode | Histogram Display | Adds delta, volume, or both histograms either inline inside the footprint or as external lanes beside it. |
| Footprint Display | Volume Text | Show Volume Numbers | Turns the bid and ask numbers inside each footprint row on or off. |
| Footprint Display | Volume Text | Volume Display Format | Chooses how volume text is written inside the row, for example separate bid and ask columns or a more compact combined format. |
| Footprint Display | Volume Text | Cell Alignment | Controls how the numbers are aligned inside each footprint row. |
| Footprint Display | Historical Footprints | Show Historical Bars | Turns footprints on or off for completed candles. |
| Footprint Display | Historical Footprints | Historical Bars Count | Sets the maximum number of completed candles that can display footprint data. |
| Footprint Display | Last Trade Marker | Show Last Trade Marker | Turns the marker on or off so the most recent traded price is easier to spot. |
| Footprint Display | Last Trade Marker | Last Trade Marker Color | Lets you choose the color used for the last traded price marker. |
| Footprint Style | Theme & Text | Color Theme | Applies a predefined palette across the footprint so you can change the full indicator look very quickly. |
| Footprint Style | Theme & Text | Font Size | Adjusts the size of the volume numbers inside the footprint rows. |
| Footprint Style | Theme & Text | Normal Text Color | Sets the default color for balanced or neutral volume numbers. |
| Footprint Style | Imbalance Colors | Imbalance Ratio | Sets how much larger one side must be than the other before a row is treated as an imbalance. |
| Footprint Style | Imbalance Colors | Bid Imbalance Color | Sets the highlight color for bid-side imbalances. |
| Footprint Style | Imbalance Colors | Ask Imbalance Color | Sets the highlight color for ask-side imbalances. |
| Footprint Style | Delta Heatmap | Show Delta Heatmap Background | Turns the row background heatmap on or off. |
| Footprint Style | Delta Heatmap | Level Delta BG Bid Color (Sells) | Sets the background color for negative delta levels where selling dominates. |
| Footprint Style | Delta Heatmap | Level Delta BG Ask Color (Buys) | Sets the background color for positive delta levels where buying dominates. |
| Footprint Style | Delta Heatmap | Level Delta Opacity | Controls how strong or transparent the heatmap background appears. |
| Footprint Style | Value Area | Show Value Area | Turns the value area highlight on or off for each bar. |
| Footprint Style | Value Area | Value Area % | Sets how much of the candle volume is included in the value area. |
| Footprint Style | Value Area | Value Area Fill | Sets the background color used for the rows inside the value area. |
| Footprint Style | Value Area | Value Area Opacity | Controls how strong or transparent the value area background appears. |
| Footprint Style | Value Area | Value Area Line | Sets the guide color for the VAH and VAL reference lines. |
| Footprint Style | Point of Control | Show POC Outline | Turns the Point of Control highlight on or off inside the footprint. |
| Footprint Style | Point of Control | POC Color | Sets the color used for the Point of Control outline. |
| Footprint Style | Point of Control | Show Naked POC Line | Extends the POC level to the right until price returns and touches it. |
| Footprint Position | Horizontal Placement | Footprint Offset Right | Moves the footprint farther to the right side of the candle. |
| Footprint Position | Zoom Behavior | Auto Scale with Zoom | Automatically adjusts the footprint size based on the chart zoom level. |
| Footprint Position | Zoom Behavior | Scale Factor | Controls the overall footprint size multiplier. |
| Footprint Position | Zoom Behavior | Hide Footprint on Deep Zoom Out | Hides footprint rows, histograms, and signal overlays when the chart is too compressed to read clearly. |
| Footprint Position | Minimum Width | Minimum Footprint Width | Sets the minimum footprint width so the rows never become too narrow to read. |
| Footprint Position | Minimum Width | Auto Scale Minimum Width | Lets the minimum width react to zoom so the footprint keeps a more natural size while scaling. |
| Footprint Position | Minimum Width | Minimum Width Zoom Multiplier | Controls how strongly the minimum width reacts to zoom changes. |
| Footprint Position | Footprint Dimensions | Footprint Width Multiplier | Adjusts the width of the footprint body independently from the candle size. |
| Footprint Position | Footprint Dimensions | Row Height Multiplier | Adjusts the vertical spacing between footprint rows. |
| Delta & Analytics | Visible Values | Show Candle Delta | Displays the total delta under each candle so you can see the final buying-versus-selling result of the bar. |
| Delta & Analytics | Visible Values | Show Bid/Ask Totals | Displays the total bid volume and total ask volume above the candle delta label. |
| Delta & Analytics | Placement & Size | Delta Offset Below | Sets how far below the candle the candle totals block is drawn. |
| Delta & Analytics | Placement & Size | Delta Font Size | Controls the font size used for the candle delta display. |
| Delta & Analytics | Placement & Size | Delta BG Opacity | Controls how solid or transparent the background behind the candle totals appears. |
| Delta & Analytics | Placement & Size | Delta BG Color | Sets the background color for the candle totals box. |
| Delta & Analytics | Direction Colors | Positive Delta Color | Sets the color used when candle delta finishes positive. |
| Delta & Analytics | Direction Colors | Negative Delta Color | Sets the color used when candle delta finishes negative. |
| Delta & Analytics | Direction Colors | Neutral Delta Color | Sets the color used when candle delta finishes near zero or neutral. |
| Delta & Analytics | Histogram Layout | Histogram Width | Sets the width of each selected histogram lane in pixels. |
| Delta & Analytics | Histogram Layout | Histogram Offset | Controls the distance between the footprint body and the histogram group. |
| Delta & Analytics | Histogram Layout | Histogram Thickness | Sets the thickness of each histogram bar. |
| Delta & Analytics | Delta Histogram Colors | Delta Positive Color | Sets the color for positive delta histogram bars. |
| Delta & Analytics | Delta Histogram Colors | Delta Negative Color | Sets the color for negative delta histogram bars. |
| Delta & Analytics | Panel Visibility | Show Delta Info Panel | Turns the bottom analytics panel on or off. |
| Delta & Analytics | Panel Layout | Panel Row Height | Sets the height of each analytics row in the panel. |
| Delta & Analytics | Panel Layout | Panel Font Size | Controls the text size used inside the analytics panel. |
| Delta & Analytics | Panel Layout | Panel Text Color | Sets the default text color used across the panel. |
| Delta & Analytics | Cell Separators | Show Cell Separators | Turns the panel separator lines on or off. |
| Delta & Analytics | Cell Separators | Separator Color | Sets the color of the separator lines. |
| Delta & Analytics | Cell Separators | Separator Opacity | Controls how visible the separator lines are. |
| Delta & Analytics | Cell Separators | Separator Thickness | Controls how thick each separator line appears. |
| Delta & Analytics | Core Rows | Show Delta | Shows or hides the Delta row in the panel. |
| Delta & Analytics | Core Rows | Show Volume | Shows or hides the Volume row in the panel. |
| Delta & Analytics | Core Rows | Show Max Delta | Shows or hides the Max Delta row. |
| Delta & Analytics | Core Rows | Show Min Delta | Shows or hides the Min Delta row. |
| Delta & Analytics | Core Rows | Show Delta Change | Shows or hides the Delta Change row. |
| Delta & Analytics | Core Rows | Show Session Delta | Shows or hides the Session Delta row. |
| Delta & Analytics | Advanced Rows | Show AVAP | Shows or hides AVAP in the panel. |
| Delta & Analytics | Advanced Rows | Show Delta % | Shows or hides delta as a percentage of total volume. |
| Delta & Analytics | Advanced Rows | Show Trades | Shows or hides the trade count row. |
| Delta & Analytics | Advanced Rows | Show Ratio | Shows or hides the ratio row. |
| Delta & Analytics | Advanced Rows | Show Volume/Sec | Shows or hides the volume-per-second row. |
| Delta & Analytics | Heatmap Backgrounds | Positive BG Color | Sets the panel background color for positive values. |
| Delta & Analytics | Heatmap Backgrounds | Negative BG Color | Sets the panel background color for negative values. |
| Delta & Analytics | Heatmap Backgrounds | Neutral BG Color | Sets the panel background color for neutral values. |
| Delta & Analytics | Heatmap Backgrounds | Volume BG Color | Sets the panel background color for volume rows. |
| Detection Zones | Zone Detection | Show Imbalance Zones | Turns persistent support and resistance zones from stacked imbalances on or off. |
| Detection Zones | Zone Detection | Consecutive Imbalance Levels | Sets how many imbalance levels must appear in a row before a zone is created. |
| Detection Zones | Zone Detection | Imbalance Zone Volume Filter | Sets the minimum aggressive volume required for each imbalance level to qualify. |
| Detection Zones | Zone Detection | Detect Imbalance on Native Ticks | Uses native tick data for imbalance detection even when price grouping is enabled. |
| Detection Zones | Footprint Highlights | Show Stacked Imbalances | Turns stacked imbalance highlights on or off inside the footprint. |
| Detection Zones | Footprint Highlights | Stacked Highlight Opacity | Controls how strong or transparent the stacked highlight appears. |
| Detection Zones | Footprint Highlights | Stacked Bid Color | Sets the color for stacked bid-side highlights, usually tied to stronger selling pressure. |
| Detection Zones | Footprint Highlights | Stacked Ask Color | Sets the color for stacked ask-side highlights, usually tied to stronger buying pressure. |
| Detection Zones | Zone Appearance | Support Zone Color (from Ask) | Sets the color for support zones created by stacked ask imbalances. |
| Detection Zones | Zone Appearance | Resistance Zone Color (from Bid) | Sets the color for resistance zones created by stacked bid imbalances. |
| Detection Zones | Zone Appearance | Imbalance Zone Opacity | Controls how strong or transparent the zone background appears. |
| Detection Zones | Zone Appearance | Stop Imbalance Zone on Touch | Stops drawing the zone after price touches it with a candle. |
| Detection Zones | Absorption Zone Detection | Show Absorption Zones | Turns absorption zone detection on or off. |
| Detection Zones | Absorption Zone Detection | Absorption Consecutive Levels | Sets how many consecutive absorption levels are needed before a zone can be created. |
| Detection Zones | Absorption Zone Detection | Absorption Percent | Sets how much stronger the aggressive volume must be than the opposite side. |
| Detection Zones | Absorption Zone Detection | Absorption Depth (Ticks) | Confirms the zone only if price moves away from the high or low by the selected number of ticks. |
| Detection Zones | Absorption Zone Detection | Absorption Volume Filter | Sets the minimum aggressive volume required at each level before it can qualify. |
| Detection Zones | Absorption Zone Appearance | Support Zone Color (from Bid) | Sets the color for support zones created by bid absorption. |
| Detection Zones | Absorption Zone Appearance | Resistance Zone Color (from Ask) | Sets the color for resistance zones created by ask absorption. |
| Detection Zones | Absorption Zone Appearance | Absorption Zone Opacity | Controls how strong or transparent the absorption zone background appears. |
| Alerts | Delivery Channels | Enable Telegram Alerts | Sends Telegram notifications when absorption signals are detected. |
| Alerts | Delivery Channels | Enable NinjaTrader Alerts | Plays the selected NinjaTrader alert when absorption signals are detected. |
| Alerts | Telegram Connection | Telegram Bot Token | Enter the API token from your Telegram bot so the indicator can send messages through it. |
| Alerts | Telegram Connection | Telegram Chat ID | Enter the personal or group chat ID where Telegram alerts should be delivered. |
| Alerts | Message & Timing | Signal Alert Message | Lets you customize the text used in the alert notification. |
| Alerts | Message & Timing | Alert on Bar Close Only | Sends alerts only after the bar closes and the absorption zone is confirmed. |
| Data & Performance | Price Profile | Enable Price Grouping | Turns custom tick grouping on or off so multiple price levels can be combined into one cleaner row. |
| Data & Performance | Price Profile | Custom Tick Multiplier | Sets how many ticks are grouped into one footprint row. |
| Data & Performance | Price Profile | Show Summary Profile | Displays an aggregated summary profile on the right side of the chart. |
| Data & Performance | Price Profile | Summary Type | Chooses between Profile and Ladder summary modes. |
| Data & Performance | Price Profile | Summary Span | Selects the range used by the summary profile, such as visible bars, day, week, or month. |
| Data & Performance | Price Profile | Summary Width | Controls the width of the right-side summary profile. |
| Data & Performance | Price Profile | Show Previous Session Levels | Displays previous-session POC, VAH, and VAL as chart references. |
| Data & Performance | Display Behavior | Show Zero Values | Shows or hides zero values inside the footprint rows. |
| Data & Performance | Total Volume Filter | Total Volume Threshold | Sets the minimum total volume required before a level is highlighted or remains visible. |
| Data & Performance | Total Volume Filter | Total Volume Mode | Controls how values below the threshold are treated. |
| Data & Performance | Bid / Ask Filters | Bid Threshold | Sets the minimum bid volume required before bid-side values remain visible or highlighted. |
| Data & Performance | Bid / Ask Filters | Bid Mode | Controls how bid values below the threshold are treated. |
| Data & Performance | Bid / Ask Filters | Ask Threshold | Sets the minimum ask volume required before ask-side values remain visible or highlighted. |
| Data & Performance | Bid / Ask Filters | Ask Mode | Controls how ask values below the threshold are treated. |
| Data & Performance | Delta Filter | Delta Threshold | Sets the minimum absolute delta required before delta values are highlighted or remain visible. |
| Data & Performance | Delta Filter | Delta Mode | Controls how delta values below the threshold are treated. |
| Data & Performance | Trade Size Filter | Use Trade Size Filter | Turns the trade-size filter on or off so only trades inside the selected size range are counted. |
| Data & Performance | Trade Size Filter | Min Trade Size | Sets the smallest trade size included in the filtered totals. |
| Data & Performance | Trade Size Filter | Max Trade Size | Sets the largest trade size included in the filtered totals. |
| Data & Performance | Processing Limit | Max Price Levels | Sets the maximum number of price levels processed per bar to protect chart performance during large or busy candles. |
| About Us | About Us | Website | Opens the main Hameral website where you can learn more about the tools and resources. |
| About Us | About Us | Shop | Opens the Hameral shop where you can discover more professional and free NinjaTrader indicators. |
| About Us | About Us | Contact Email | Shows the support email you can use if you need help with the indicator or your license. |
Website & Support
Official Website
Visit https://hameral.com/ for product information, updates, downloads, and contact details.
Client Tip
Keep this guide with your Hameral purchase files so you always have the install steps and settings reference available when setting up a new chart or workspace.
Recommended Setup For Best Performance
To get the best experience with Hameral Footprint PRO, we recommend following a few simple setup rules. Footprint indicators process a lot of tick data, so the way you load the chart can have a big impact on speed and performance.
How can I modify the footprint settings?
Use the Footprint Terminal.
You can modify the footprint settings directly from the Hameral Footprint PRO Terminal.
To open it, go to the top bar of your NinjaTrader chart and click the button with your instrument name followed by Terminal. For example, on an NQ chart, it may appear as NQ | Terminal.
We recommend using the terminal instead of the classic NinjaTrader indicator properties window, because changes made from the terminal are applied faster and do not require the indicator to reload and recalculate all loaded historical data.
I added the footprint indicator, but I don’t see it clearly. What should I do?
Zoom In After Loading: After loading the footprint, the main adjustment you usually need is to zoom in.
Modify the candle width: If the footprint looks compressed or the numbers are hard to read, adjust the candle width until the footprint displays properly.
To do this, double-click on the candle to open the chart style settings. Then find Bar width and set a lower number. This will make the candles thinner and give the footprint more space to display the numbers clearly.
After changing the bar width, you can also zoom in or adjust the chart spacing until the bid/ask numbers, histograms, and footprint rows are easy to read.
I see the footprint only starting from the candle where I opened the chart. Why don’t I see previous candles?
Enable Tick Replay for Historical Data: To display historical footprint data, Tick Replay must be enabled. If Tick Replay is not active, the footprint will start building only from the moment you open the chart.
To enable it, right-click on the chart, go to Data Series, check Tick Replay, and click OK. If you do not see Tick Replay there, go to Tools > Options > Market Data, enable Show Tick Replay, click OK, then return to Data Series and activate it on the chart.
I activated Tick Replay and the chart takes too long to calculate and load. What should I do?
Tick Replay requires more processing because the indicator must calculate historical tick data. To improve loading speed, reduce the amount of historical data loaded on the chart.
Load Only the Data You Need: If you need historical data, load only around 50 bars or maximum the current day. This helps the indicator calculate faster and reduces the load on your computer.
To adjust this, right-click on the chart, open Data Series, and set Load data based on to Bars with around 50 bars, or to Days with 0 for the current day.
How can I make my footprint load faster?
Keep the Chart Clean: Avoid adding many other indicators on the same footprint chart. Each additional indicator can slow down the chart and increase processing time.