💡PRO ORDERFLOW PACK
Hameral Super Oscillator PRO Indicator for
NinjaTrader

📌 What is SuperOscillator?
The Hameral Super Oscillator PRO is a powerful multi-oscillator indicator that blends five classic momentum tools into one unified output. Designed to reveal clean overbought and oversold signals, it filters out noise and highlights key reversal zones with high-precision visual cues. Signal dots are only drawn when the market shows both technical and candlestick confirmation of exhaustion, giving traders an edge in spotting strong reversal opportunities.

🔍 What are the Functions of Super Oscillator?
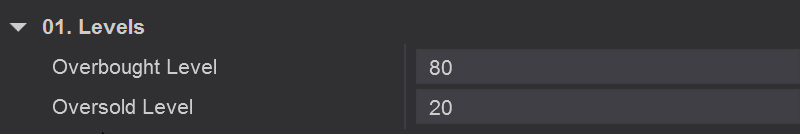
📐 Levels
- Overbought Level – Defines the custom threshold above which the oscillator is considered overbought. Default is
80. - Oversold Level – Defines the custom threshold below which the oscillator is considered oversold. Default is
20.
These levels allow traders to adapt the indicator’s sensitivity to market conditions. When the oscillator crosses into or out of these zones, it may signal exhaustion, reversal setups, or trend continuation pressure depending on price context and candlestick confirmation.
⚙️ Core Calculation Parameters
- MFI Period – Sets the period for the Money Flow Index, a volume-weighted momentum indicator. Default:
14. - Williams %R Period – Period for Williams %R, measuring overbought and oversold conditions relative to recent highs and lows. Default:
14. - TDI RSI Period – Period of the RSI used in the Traders Dynamic Index calculation. Default:
13. - TDI Fast MA Period – Fast moving average applied to the TDI RSI value. Default:
2. - TDI Slow MA Period – Slow moving average applied to the TDI RSI. Default:
7. - Stochastic Period K – Lookback period for the %K line of the Stochastic oscillator. Default:
14. - Stochastic Smooth – Smoothing factor applied to the %K line. Default:
3. - Stochastic Period D – Period for the %D line (smoothed signal) of the Stochastic. Default:
3. - MA Period – Period for the moving average applied directly to the oscillator output line. Default:
9.
These parameters control how each of the five integrated oscillators is calculated. You can adjust them to fine-tune the responsiveness of the composite output, depending on your trading timeframe or volatility conditions.

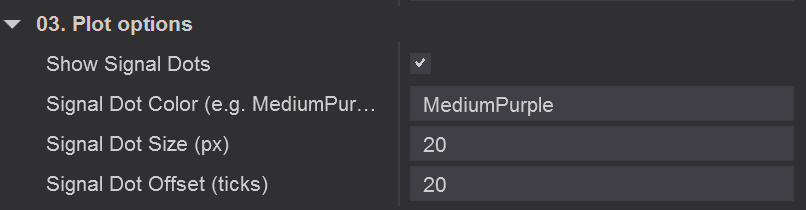
🎨 Plot Options
- Show Signal Dots – Enables or disables the display of reversal signal dots directly on the chart. When enabled, dots appear only when the oscillator is in an extreme zone and confirmed by strong price rejection candles.
- Signal Dot Color – Customize the color of the reversal dots using a color name (e.g.,
MediumPurple). This allows clear visual contrast with your chart theme. - Signal Dot Size (px) – insert the dot size that you want
- Signal Dot Offset (ticks) – select the distance between the candles and the dot
Signal dots are an essential visual confirmation tool. They only trigger when both oscillator extremes and candlestick exhaustion align, helping traders avoid false reversals and spot strong turning points with more clarity.
⚠️ Important: Use the signals with caution. They are most effective when used in confluence with key levels, during balanced market conditions, or when the market is clearly overextended. Signals are not guaranteed to produce profitable trades and should always be confirmed with additional context or tools.
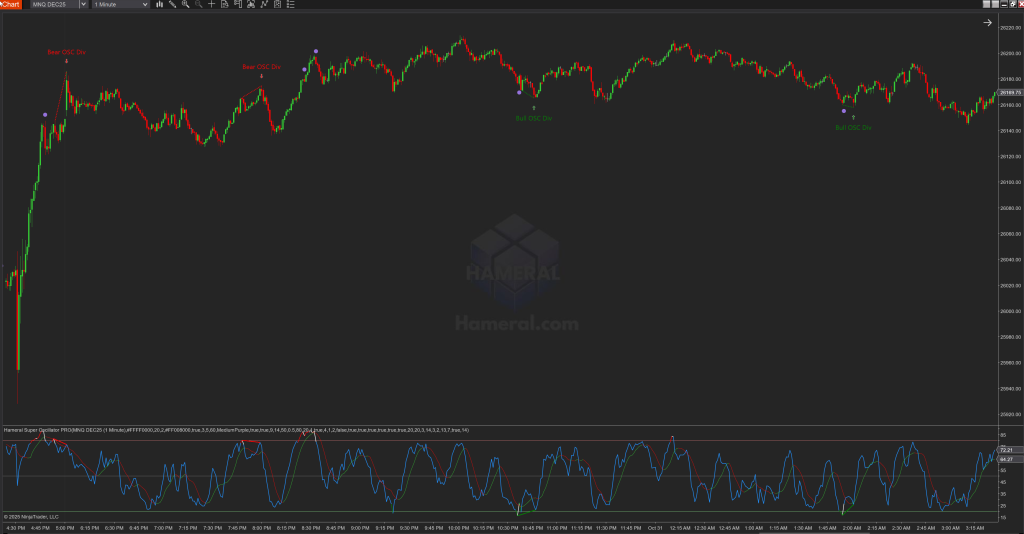
⚖️ Divergences
There are two types of divergence detection:
1. Final Divergence – This is plotted after a certain number of candles, once the divergence is confirmed. Although it appears later, it still provides valuable insight into the market’s underlying intention.
2. Provisional Divergence – This is a real-time analysis that anticipates potential divergences. Depending on your settings, the provisional divergence will disappear after a set number of candles if the divergence is not confirmed.
This provisional signal acts as an early alert, indicating that price and Super Oscillator are starting to disagree. It may later develop into a confirmed (final) divergence or simply represent a temporary fluctuation that doesn’t impact the main trend.
1. Confirmed Divergence
- Choose if you want to show on the chart: Divergence, Hidden Divergence, the divergence line, arrow or text when the divergence happens.
- Divergence calculation settings:
- Divergence Pivot Strenght
The Divergence Pivot Strength setting determines the number of bars on each side of a pivot high or low required to identify a divergence.
For example, the default value is 5. If the indicator detects five candles on the right that are lower and five candles on the left that are lower, it identifies that point as a pivot high (a local peak). The indicator then compares this point with the previous one to determine whether it’s a higher high or a lower high.
The same logic applies to both the price chart and the Super Oscillator chart. When their behaviors differ – for instance, the price forms higher highs while the Super Oscillator forms lower highs – the divergence option will highlight this on the chart.
This pivot setting helps filter out noise and focus only on significant market swings.
A higher value means stronger and cleaner divergence signals, but also fewer detections. -
Max Bars Between Pivots acts like a memory limit. It answers the question:
“How far back in time should we look to compare a new price swing with an old one?”As mentioned earlier, a divergence is always a comparison between two points – either two peaks or two valleys. This setting defines the maximum number of bars allowed between those two points.
For example, the default value is 50. This means that if one peak forms and another peak appears within the next 50 candles, the indicator will analyze them to determine whether a divergence exists.
However, if more than 50 candles have passed before a new peak forms, the indicator considers the previous one too old for comparison and ignores it. -
Price Tolerance (in ticks) allows you to give the indicator a bit of flexibility when detecting new highs and lows. Sometimes, strict rules can cause valid divergences to be missed.
Think of this setting as a “close enough” rule for the indicator.
Normally, for a bearish divergence, we look for a higher high in price. But what if the second peak is just slightly lower than the previous one? Without tolerance, the indicator would ignore it.For example, with the default value set to 1 tick, if the price forms a new high that’s just one tick lower than the previous high, the indicator will still treat it as a higher high and include it in the comparison with the Super Oscillator to determine if a divergence exists.
-
Osc Tolerance (in percentage) filters out insignificant differences between the highs and lows of price and Super Oscillator.
For example, let’s say the price is making higher highs, while the Super Oscillator Pro is almost flat — forming a slightly lower high. The difference is so small that it doesn’t really represent a meaningful disagreement between price and delta. Should this be considered a strong divergence? No, and that’s exactly why this filter exists.
A tolerance of 0.5% means that the lower high on the Super Oscillator must be at least 0.5% lower than the previous high value to qualify as a valid divergence.
For example, if the previous high was x, then the new high must be at or below x – (0.5% × x) for the indicator to consider it a significant divergence.
- Divergence Pivot Strenght
- You can choose your favourite colors for Bullish and Bearish divergence.
2. Provisional Divergence
Provisional Divergence allows you to see potential divergences as they start to form.
This divergence is temporary – it will either be confirmed and turned into a fixed divergence, or it will disappear from the chart if not confirmed.
It helps you spot potential divergences earlier and react faster to market changes.
You can customize several options:
-
-
Use Provisional Line – enables the display of provisional divergence lines.
-
Provisional Expiry – Delete After X Candles: automatically removes the provisional divergence if it isn’t confirmed within a set number of candles.
-
Show Arrow and Text – displays visual markers for easier identification.
-
Live Update Pre-Divergence – allows the indicator to update the provisional line after each candle, keeping the information fully dynamic in real time.
-
Pre ZigZag Retrace defines how much the price must move (up or down) before the indicator recognizes it as a true swing rather than just a pause or minor fluctuation.
For example, with the default value set to 4, if the price makes a new high, the indicator monitors the retracement.
If the price pulls back only 1–2 ticks, it treats that movement as noise.
However, if it retraces 4 ticks, the indicator considers it a potential turning point — marking that high as a temporary peak and starting to look for a possible divergence.In short, this setting acts as a noise filter, ensuring the indicator only reacts to significant pullbacks that may signal a change in direction.
-
Pre Pivot Soft Strength (in bars) prevents false signals that may appear when a new high is detected and the price immediately retraces a few ticks (e.g., 4 ticks). This can happen frequently and generate many false pre-alerts.
-
With Pre Pivot Soft Strength = 1, the indicator waits for one full bar to close before officially marking a temporary peak and drawing provisional lines.
-
With Pre Pivot Soft Strength = 2, it waits for two bars to close after the “extreme point.”
-
- Pre Use Intrabar Eval allows the indicator to evaluate provisional lines on every tick when the box is checked.
If unchecked, the evaluation occurs only at each bar close.
-
📉 Bollinger Bands (Optional)
- Show Bollinger Bands – Toggle to enable or disable Bollinger Bands plotted around the oscillator line.
- Bollinger Period – Sets the number of bars used to calculate the Bollinger Bands. Default is
20. - Bollinger StdDev – Defines how many standard deviations away from the mean the bands are plotted. Default is
2.0.
Use Bollinger Bands to visualize volatility and detect extreme deviations of the oscillator from its mean, helping identify potential mean-reversion setups.
📈 How to Use Super Oscillator Effectively?
The Hameral Super Oscillator PRO is designed to simplify momentum analysis by combining multiple oscillators into one intelligent signal line. Here’s how to get the most out of it:
✅ 1. Identify Reversal Zones with Confidence
- Watch for the oscillator to reach –
above 80 or below 20. - Look for the line to reverse direction (e.g., turning down from 85 or up from 15).
- Use the Signal Dots as confirmation – they appear only when a strong price rejection occurs (like a candle closing near its low or high).
🔍 2. Confirm with Key Levels
- Only act on signals that align with important **support/resistance zones**, **VWAP**, **previous session highs/lows**, or **volume profile edges**.
- The oscillator is most reliable in **balanced** or **overextended** market conditions – avoid noisy sideways chop.
📊 3. Use Moving Average & Bollinger Bands for Trend Context
- The built-in Moving Average helps smooth signals and spot trend continuation or divergence.
- If enabled, the Bollinger Bands around the oscillator show when price is stretching too far from mean momentum, giving early signs of potential reversals or exhaustion.
⚠️ 4. Don’t Use It Blindly
- This is not a “buy or sell signal” tool on its own – always confirm with **price structure**, **volume behavior**, or **order flow**.
- Example mistake: Entering every time the oscillator hits 80/20 without confluence = poor results.
Pro Tip: Combine the oscillator with volume divergence, price action patterns (e.g., pin bars, engulfing), or higher-timeframe bias for high-probability setups.
Reminder: No indicator can predict the market with certainty. Always apply risk management and test signals in a demo or strategy tester first.

🛠️ How to Install Super Oscillator in NinjaTrader 8
- Download the pack: HameralOrderFlowIndicatorsPRO.zip
- In NinjaTrader, go to Tools → Import → NinjaScript Add-On
- Select the ZIP file and click Open
- Restart NinjaTrader 8
- Right-click chart → Indicators → Search “Hameral”
- Add it to your chart and customize it
📥 Get The Order Flow Basic Pack For FREE
Just sign up for our newsletter and get the full Hameral Basic Order Flow Pack instantly. This includes:
- ✅ Volume Profile Basic
- ✅ VWAP Basic
- ✅ Delta Bars Basic
- ✅ Footprint Basic
- 🎁 Bonus: Super Oscillator + Trading Template
💼 Need Advanced Order Flow Tools?
Looking for more flexibility and institutional-grade control? You’ll love the Hameral Pro Order Flow Pack, which includes:
- 📊 Session-by-session & Multi-Timeframe Volume Profiles
- 📌 Anchored Volume Profile
- 📈 Multi-Session VWAP with Standard Deviation Bands
- 📍 Anchored VWAP
- 📉 Cumulative Delta
- 🕯️ Advanced Footprint Chart — visualize order flow inside each candle, including absorption, delta, and more
- ⚡ Super Oscillator PRO with Market Extension Trigger