
💡PRO ORDERFLOW PACK
Ninja Trader Order Flow Volume Profile PRO Indicator
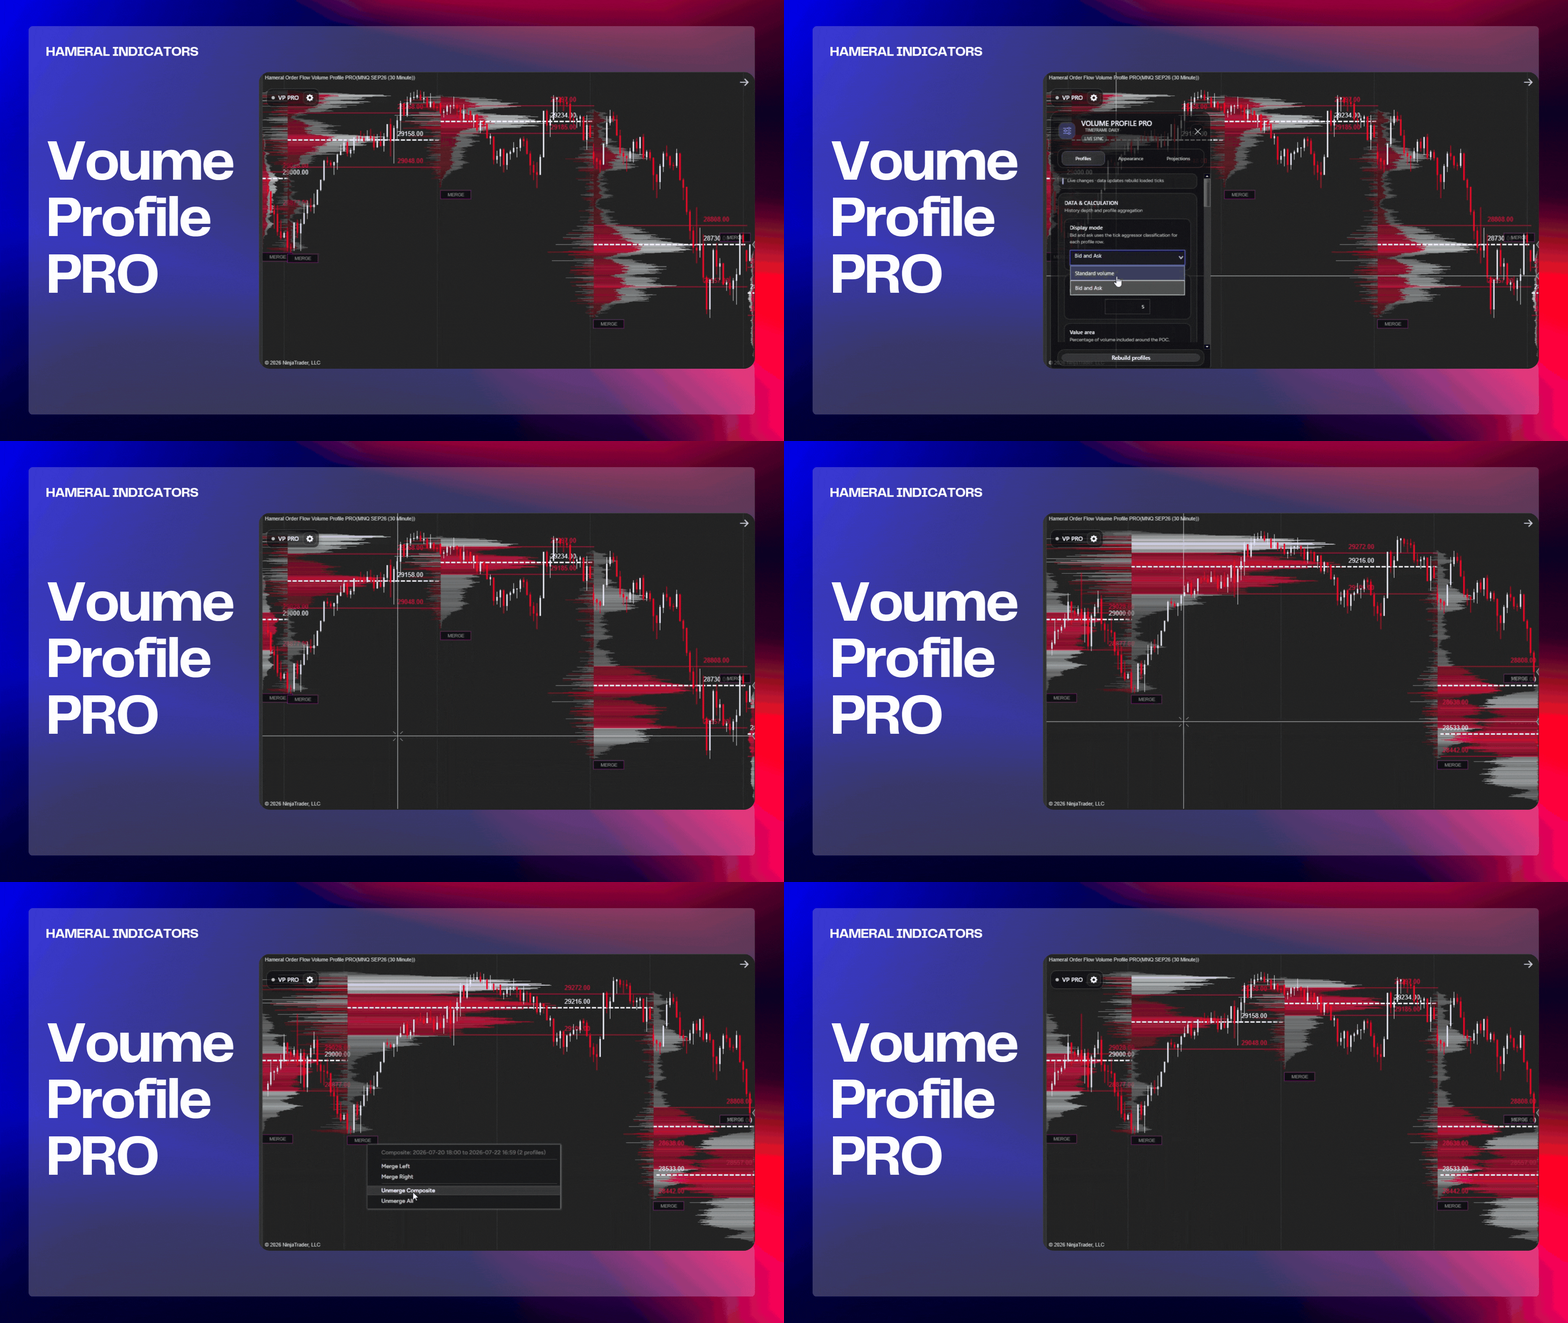
Hameral Volume Profile PRO
Professional Volume Profile for NinjaTrader
Hameral Volume Profile PRO reveals exactly where the market traded the most volume, helping you identify institutional activity, high-interest price zones, and key support and resistance levels.
Create profiles for any timeframe, custom trading session, or fixed time period. Display Point of Control (POC), Value Area High (VAH), Value Area Low (VAL), Delta Profile, historical projections, and much more—all fully customizable.
Real-Time Control Center
Unlike traditional Volume Profile indicators, Hameral Volume Profile PRO includes a powerful real-time Control Center, allowing you to modify settings directly from the chart without opening the NinjaTrader indicator properties or waiting for a reload.
Advanced Historical Cache System
The indicator stores processed historical profile data in a dedicated cache. Once a chart has been loaded, reopening the same setup can take only a few seconds—even when using large Weekly or Monthly Volume Profiles.
New Control Center
One of the biggest improvements in Version 2 is the new Volume Profile Control Center.
Instead of opening the indicator settings every time you want to make a change, you can modify almost every parameter directly from the chart and instantly see the result.
The Control Center is divided into three tabs:
Profiles
Everything related to how the Volume Profile is calculated.
Choose the profile type, timeframe, sessions, custom periods, composite profiles, value area calculation, tick grouping, and other calculation parameters.
Appearance
Everything related to how the Volume Profile looks.
Customize colors, histogram width, opacity, profile placement, Delta Profile, POC, VAH and VAL styling, labels, gradients, and other visual options to match your chart setup.
Projections
Everything related to historical levels.
Choose which previous POCs, VAHs, and VALs should be extended toward the current market, how many historical levels remain visible, and customize the style of the projected lines.
Data & Calculation
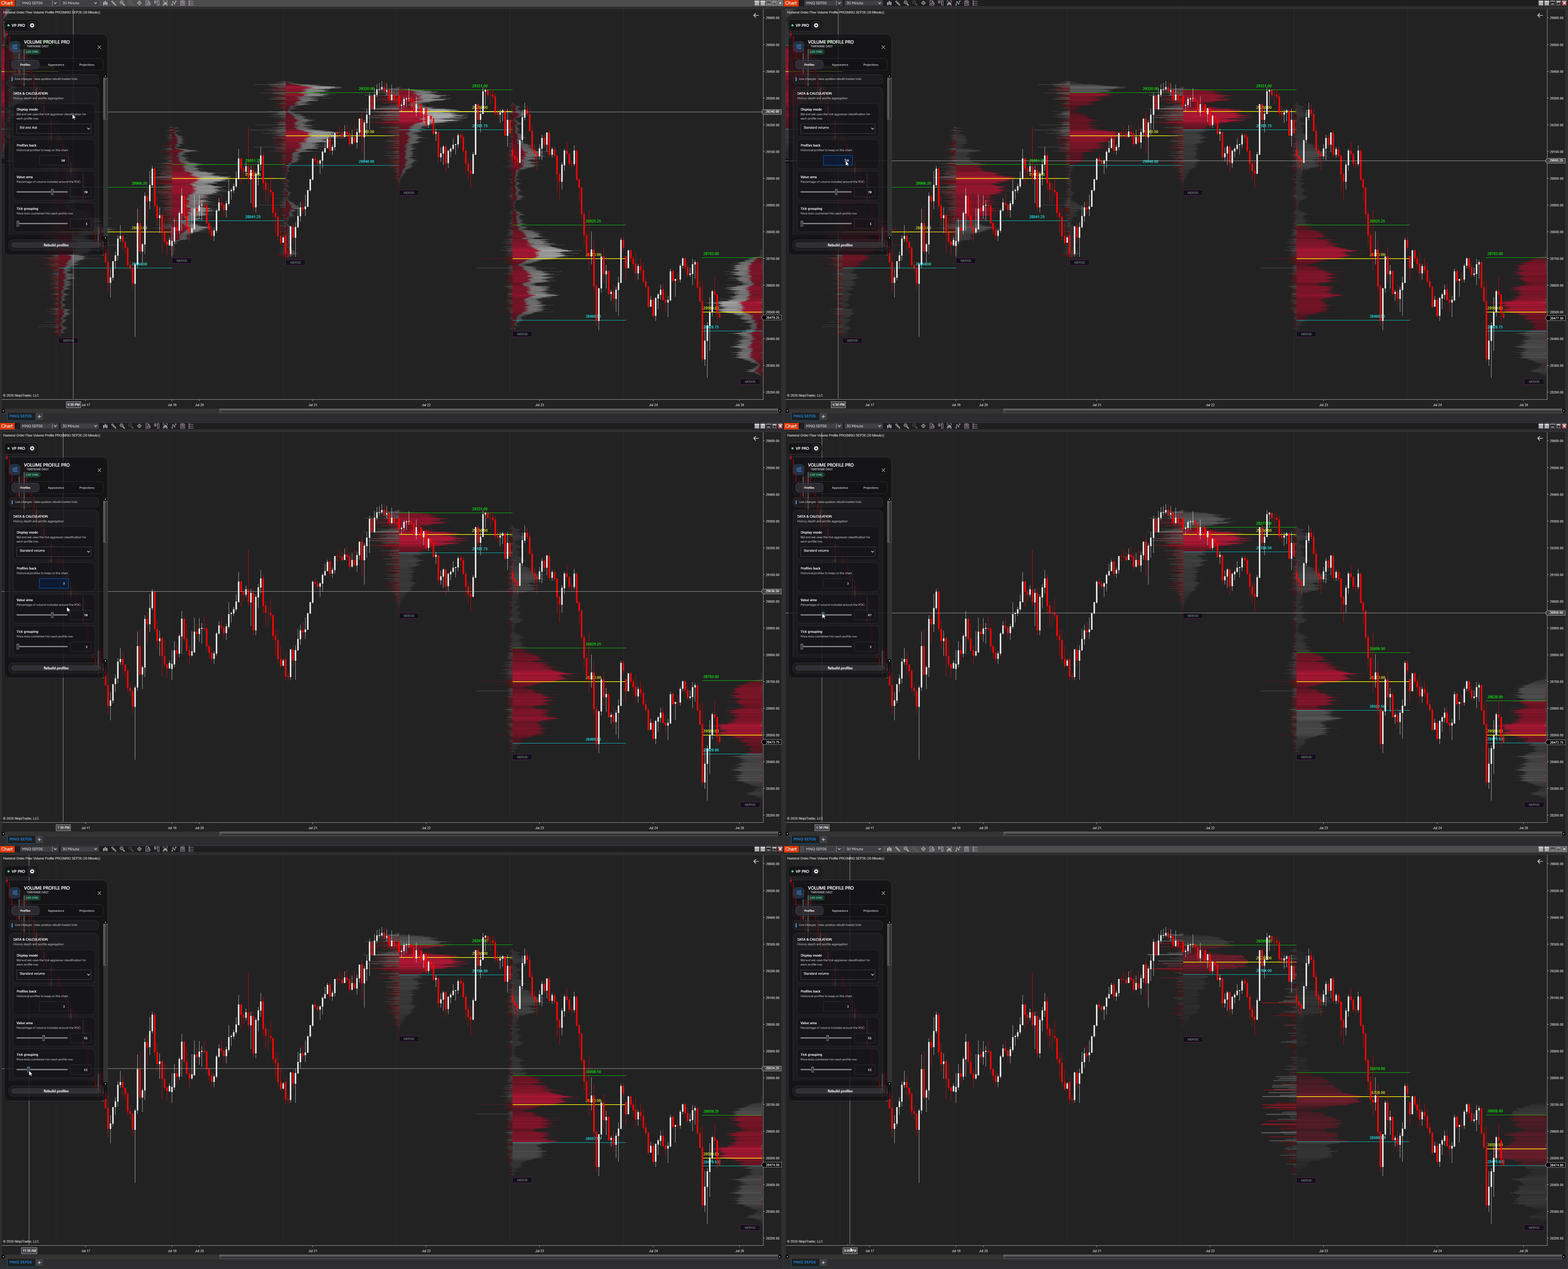
The Data & Calculation section controls how the Volume Profile is built from market data.
Here you can configure:
Display Mode – Switch between the Standard Volume Profile and Bid/Ask Profile display modes.
Profiles Back – Choose how many historical profiles are calculated and displayed on the chart.
Value Area % – Define the percentage of total traded volume used to calculate VAH and VAL around the POC.
Tick Grouping – Combine multiple price ticks into one profile row to reduce visual noise and improve performance on high-volume instruments.
This section forms the foundation of every profile, allowing you to balance calculation precision, chart readability, and platform performance.
Profile Sources
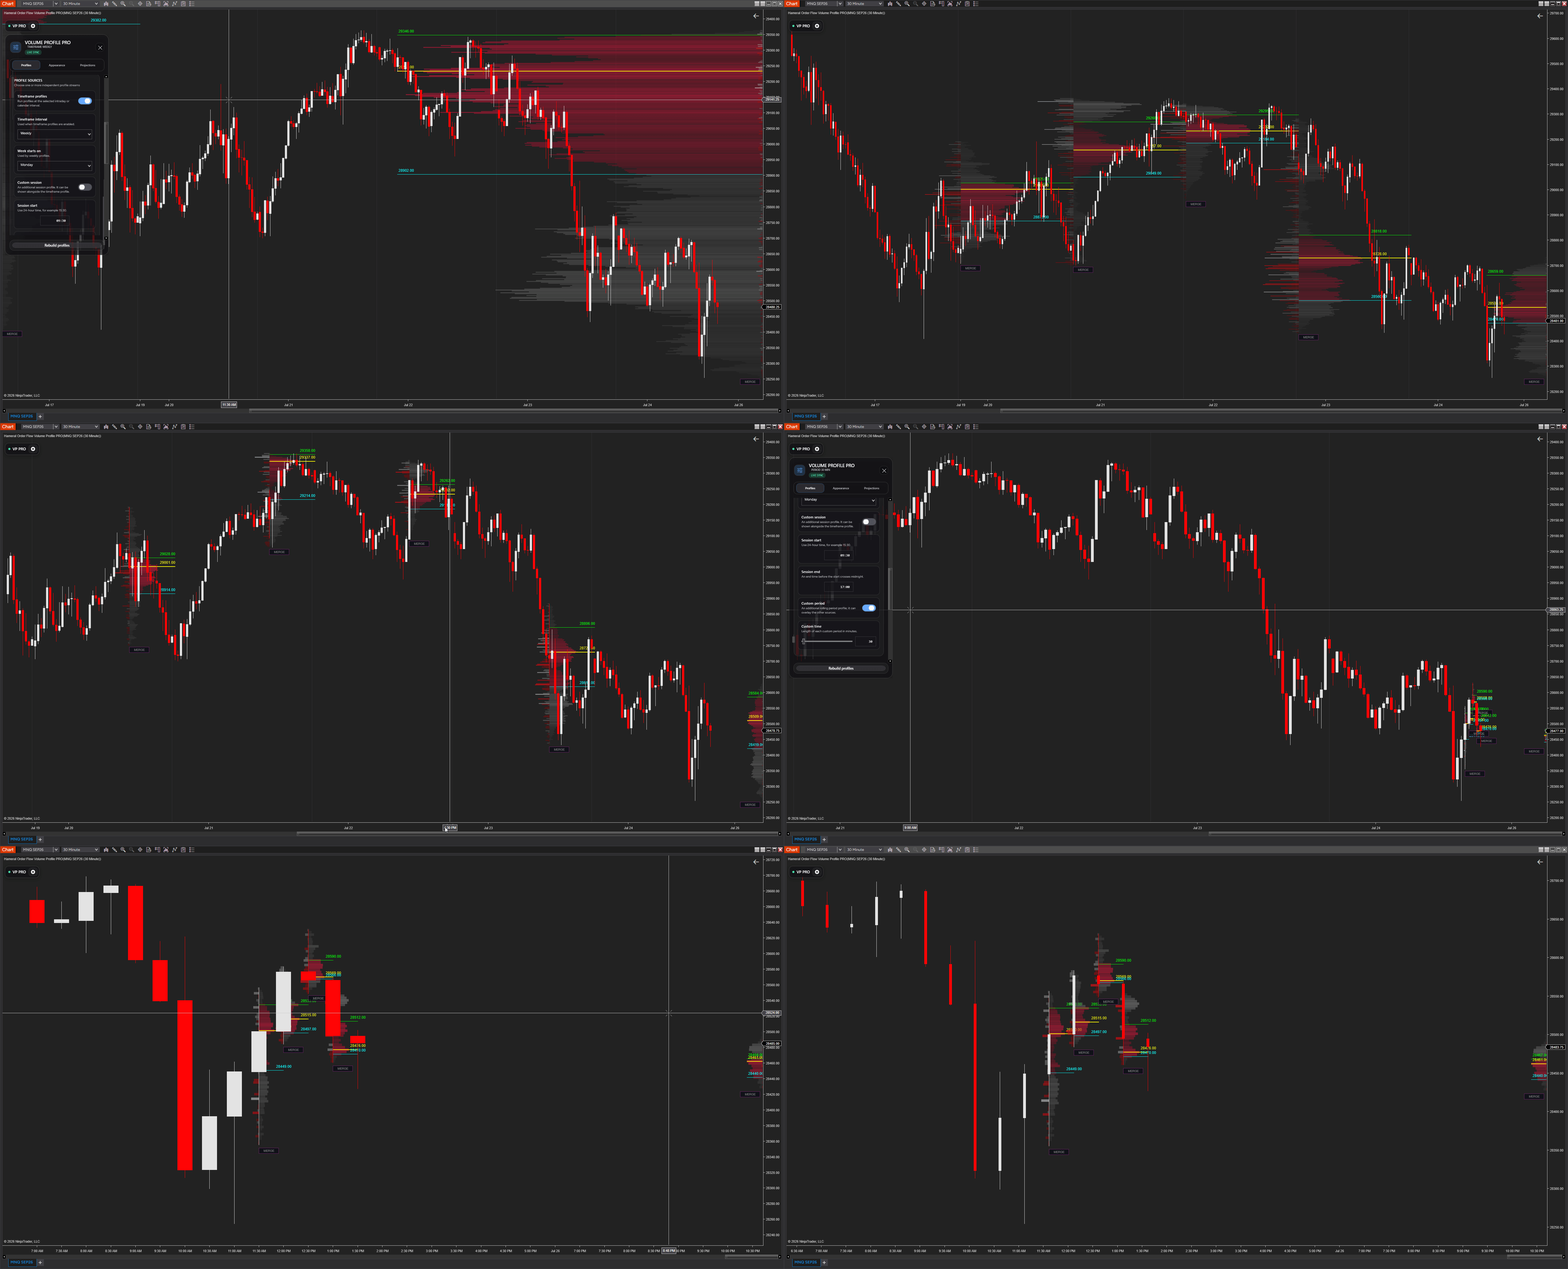
The Profile Sources section lets you choose when each Volume Profile begins and ends.
You can activate one or multiple profile types at the same time, allowing different Volume Profiles to be displayed together on the same chart.
- Timeframe Profiles – Create profiles based on predefined intervals, from 1-minute profiles up to Daily, Weekly, and Monthly profiles.
- Timeframe Interval – Choose the interval used to create each timeframe-based profile.
- Week Starts On – Select the first day used for Weekly Volume Profiles.
- Custom Session – Create an additional profile based on your own trading-session hours.
- Session Start and End – Define the exact beginning and ending time of the custom session. Sessions that cross midnight are also supported.
- Custom Period – Generate additional profiles using a fixed number of minutes inside the trading session.
- Custom Time – Choose the duration of each custom-period profile, from 1 to 1,440 minutes.
These profile sources work independently, giving you the flexibility to combine Daily, session-based, and custom-period profiles within one chart setup.
Configured Composite Profile
The Configured Composite Profile allows you to build a single Volume Profile from a custom range of historical data instead of using individual sessions.
This is ideal for analyzing larger market structures, identifying long-term value areas, and finding major support and resistance zones.
Available options include:
Configured Composite – Enable or disable the Composite Profile.
Range Type – Choose how the composite is built:
- Selected Calendar Period
- Rolling Calendar Periods
- Custom Date Range
Period Unit – Build the composite using complete calendar Weeks or Months.
Week Starts On – Define the first day of the week when using Weekly composites.
FUNCTIONS:
- Reference Date – Select any date inside the desired week or month to generate the complete calendar profile.
- Rolling Periods – Automatically combine the latest X calendar weeks or months into one profile.
- Start Date & End Date – Build a Composite Profile using any custom historical date range.
Resolved Range – Displays the exact period currently used to calculate the Composite Profile.
The Configured Composite Profile makes it easy to study long-term volume distribution without manually merging multiple profiles.

Display & Placement
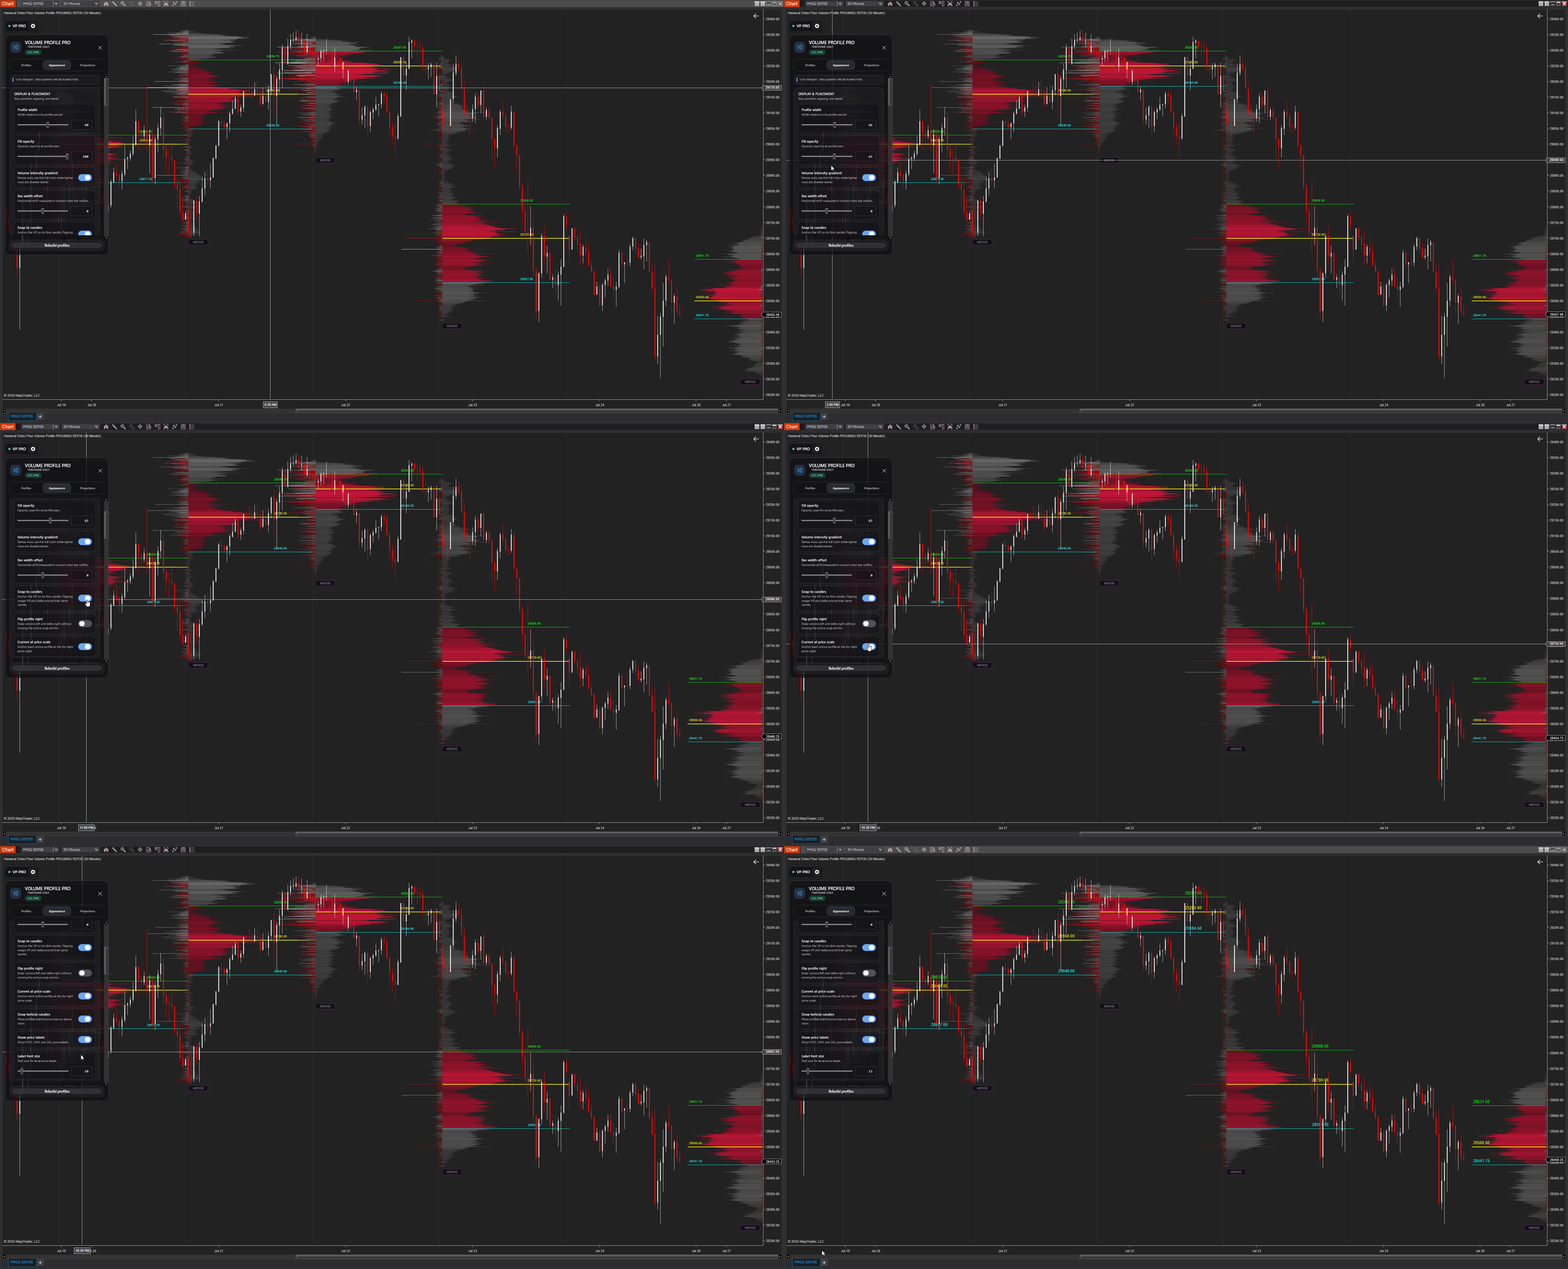
The Display & Placement section gives you complete control over how the Volume Profile is displayed on your chart. Customize its size, position, visibility, labels, and overall appearance to match your trading workflow.
- Profile Width – Adjust the width of the Volume Profile relative to its calculation period.
- Fill Opacity – Control the transparency of the profile histogram.
- Volume Intensity Gradient – Automatically highlight high-volume price levels with stronger colors while fading lower-volume areas for improved visual clarity.
- Bar Width Offset – Move the profile horizontally by a custom number of bar widths to better fit your chart layout.
- Snap to Candles – Automatically anchor each Volume Profile to its first candle, ensuring perfect alignment with price action regardless of zoom level.
- Flip Profile Right – Instantly switch the profile orientation, displaying the Volume Profile on one side of the candles and the Delta Profile on the opposite side.
- Current Profile at Price Scale – Display the active Volume Profile directly next to the price scale, keeping the latest profile always visible without covering the candles.
- Draw Behind Candles – Place the Volume Profile behind price bars for a cleaner chart or draw it in front for maximum visibility.
- Show Price Labels – Display the exact prices of the Point of Control (POC), Value Area High (VAH), and Value Area Low (VAL).
- Label Font Size – Adjust the size of the POC, VAH, and VAL price labels.
This section allows you to create a clean, professional chart layout while keeping the most important volume information exactly where you need it.
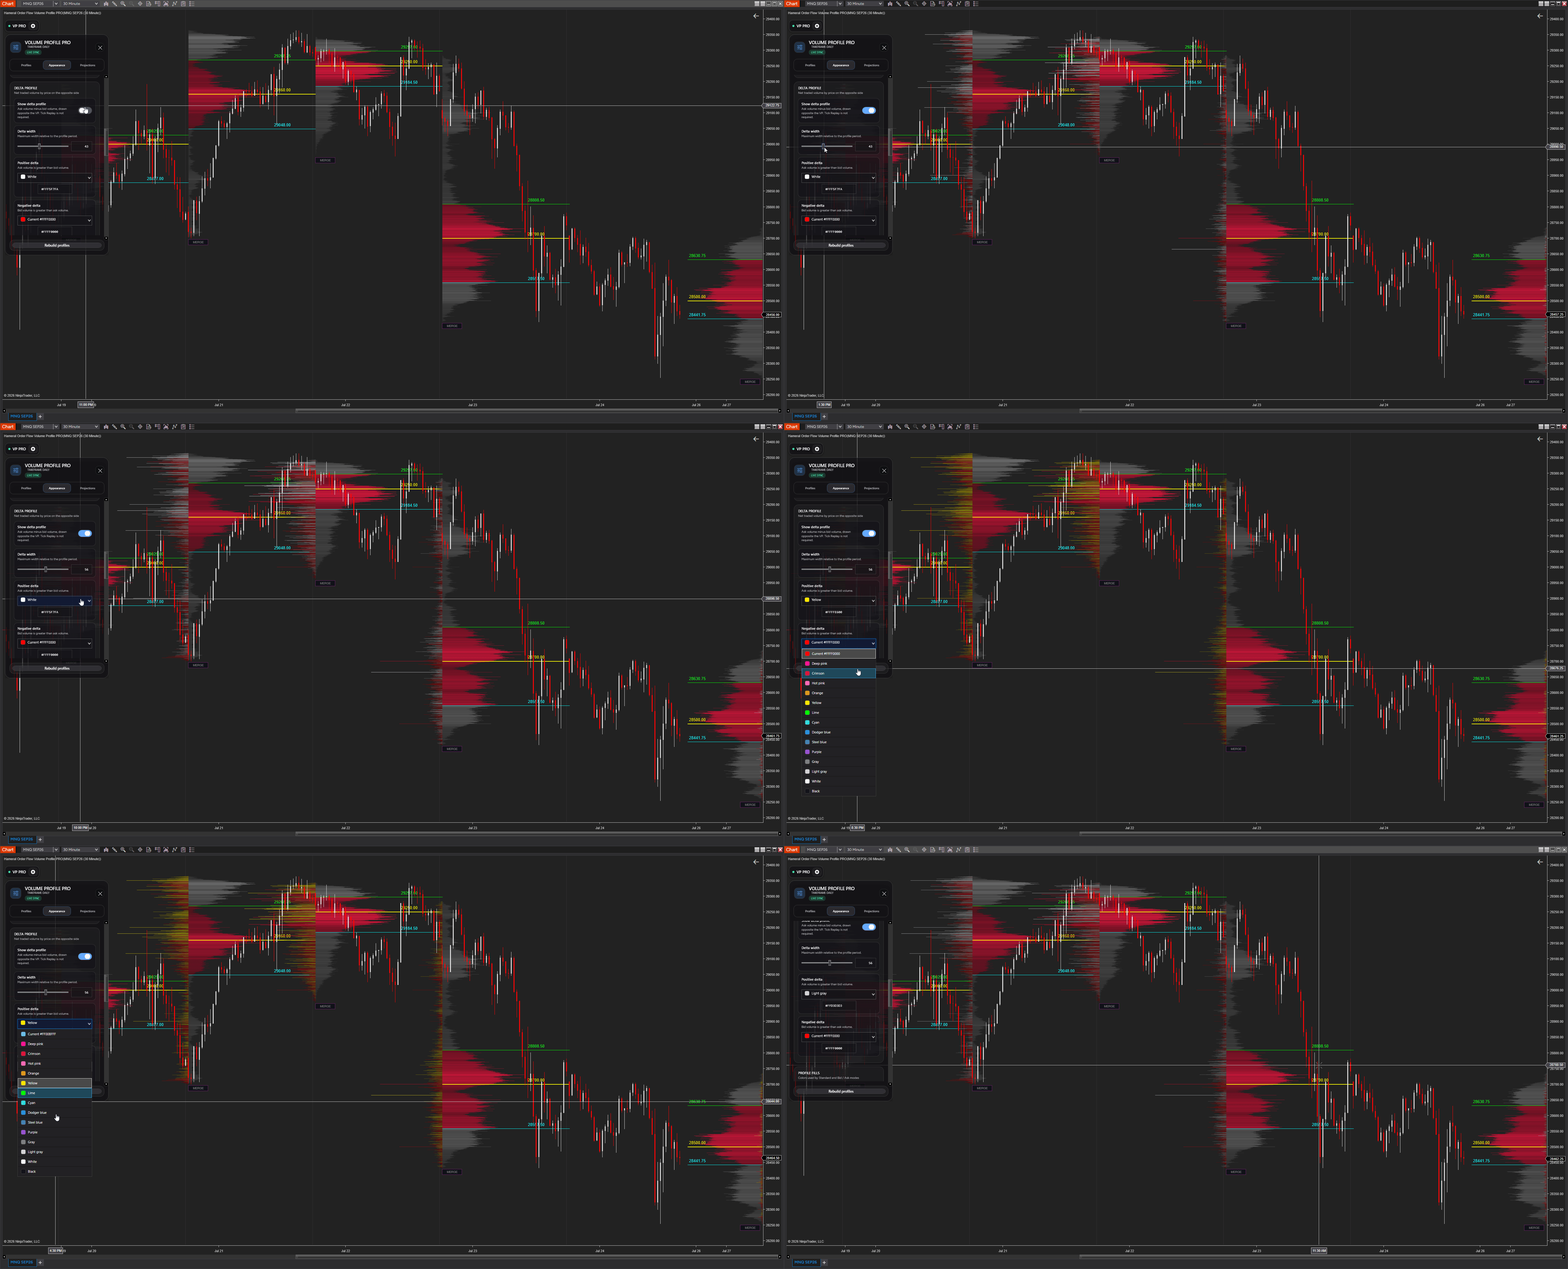
Delta Profile
The integrated Delta Profile displays the difference between aggressive buying and aggressive selling at every price level, giving you a deeper understanding of market participation alongside the traditional Volume Profile.
Unlike many other solutions, the Delta Profile is calculated directly by the indicator and does not require Tick Replay, providing fast loading while preserving historical delta information.
- Show Delta Profile – Enable or disable the Delta Profile independently from the Volume Profile.
- Delta Width – Adjust the maximum width of the Delta Profile relative to the selected Volume Profile.
- Positive Delta Color – Customize the color used when aggressive buyers dominate at a price level.
- Negative Delta Color – Customize the color used when aggressive sellers dominate at a price level.
The Delta Profile is displayed opposite the Volume Profile, making it easy to compare traded volume with buying and selling pressure at every price level.
Profile Fills
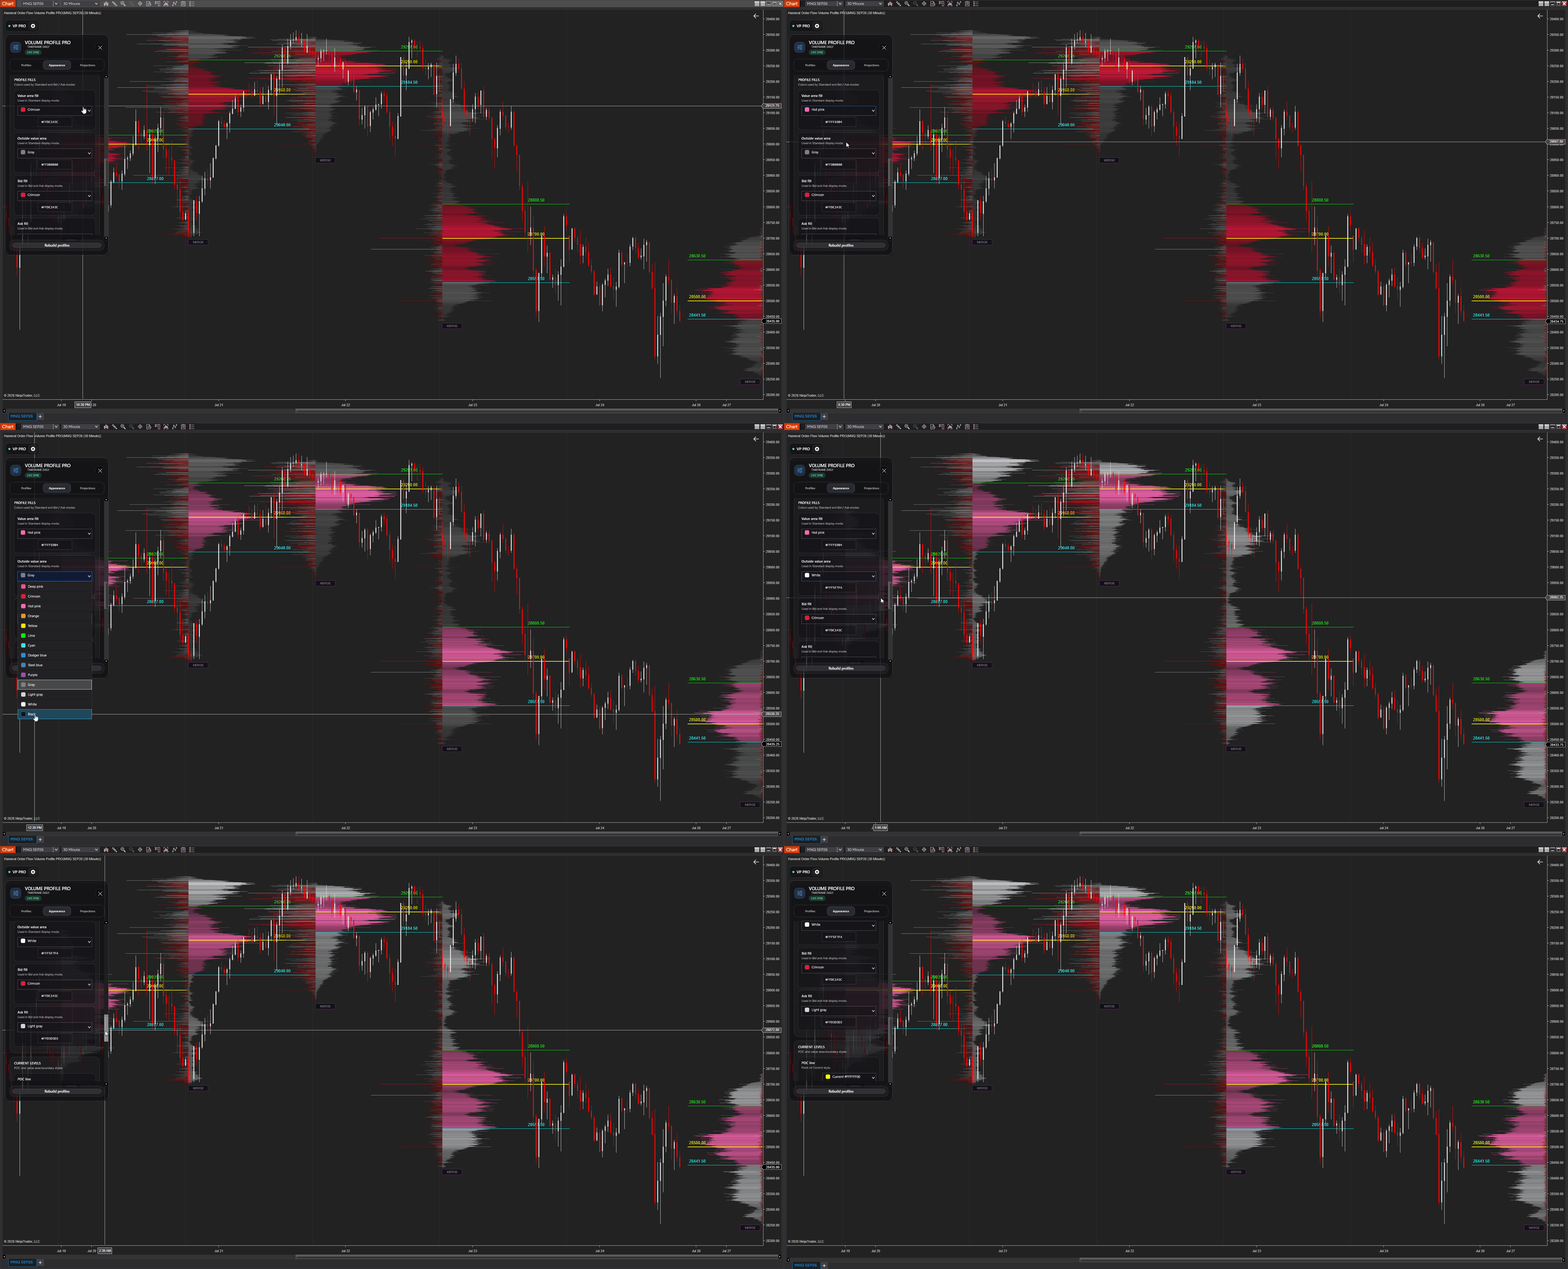
The Profile Fills section lets you fully customize the colors used by the Volume Profile, making it easy to match your trading workspace or highlight the information that matters most.
- Value Area Fill – Select the color used for the Value Area when the indicator is displayed in Standard Volume Profile mode.
- Outside Value Area – Choose the color used for price levels outside the Value Area in Standard Volume Profile mode.
- Bid Fill – Customize the color of the Bid histogram when using the Bid/Ask Profile display mode.
- Ask Fill – Customize the color of the Ask histogram when using the Bid/Ask Profile display mode.
Combined with the Volume Intensity Gradient, these color settings help you instantly distinguish important volume areas while keeping your charts clean and easy to read.
Current Levels
The Current Levels section allows you to fully customize the appearance of the most important Volume Profile reference levels displayed on the active profile.
- POC Line – Customize the color, thickness, opacity, and line style of the Point of Control (POC), the price level with the highest traded volume.
- VAH Line – Customize the appearance of the Value Area High (VAH), the upper boundary of the Value Area.
- VAL Line – Customize the appearance of the Value Area Low (VAL), the lower boundary of the Value Area.
Each level can be styled independently, allowing you to emphasize the levels that are most important for your trading strategy while maintaining a clean and professional chart layout.

Projections Tab
Historical Projections
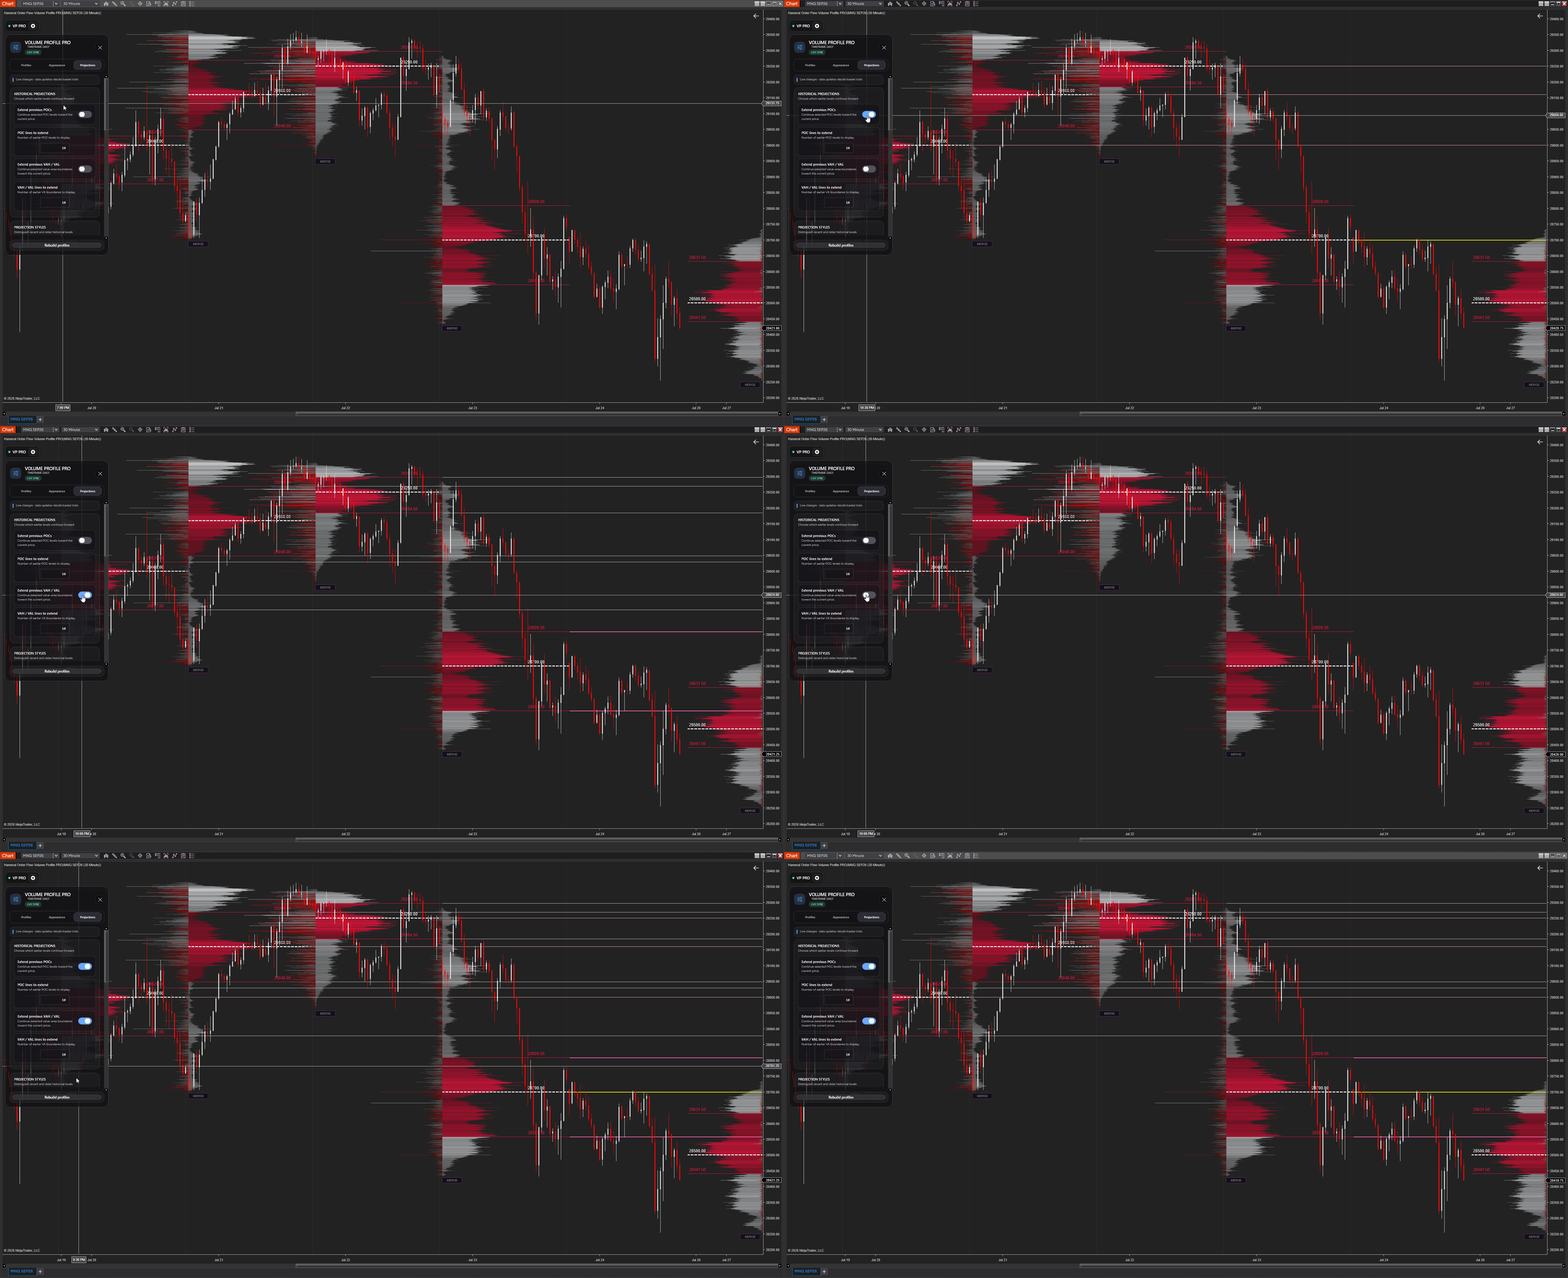
The Historical Projections section allows you to extend important Volume Profile levels from previous profiles toward the current market, making it easier to identify areas where price may react in the future.
- Extend Previous POCs – Display the Point of Control (POC) from previous Volume Profiles as projected horizontal levels.
- POC Lines to Extend – Choose how many previous POC levels remain visible on the chart.
- Extend Previous VAH / VAL – Display the Value Area High (VAH) and Value Area Low (VAL) from previous profiles as projected support and resistance levels.
- VAH / VAL Lines to Extend – Define how many historical Value Area levels should be extended.
Historical projections help you quickly identify previously accepted value areas that may continue to influence future price action.
Projection Styles
The Projection Styles section lets you customize the appearance of every projected historical level, making it easy to distinguish the most recent levels from older ones.
- Previous POC – Customize the color, thickness, opacity, and line style of the most recent projected Point of Control.
- Previous VAH / VAL – Customize the appearance of the most recent projected Value Area High and Value Area Low levels.
- Older POCs – Apply a different style to older projected POC levels, helping you quickly separate recent market structure from historical reference levels.
- Older VAH / VAL – Customize the style of older projected Value Area High and Value Area Low levels independently from the most recent ones.
By using different colors, widths, and line styles, you can instantly recognize which historical levels are recent and which come from older trading sessions, creating a cleaner and more informative chart.

✅ Best Used On
- Markets: MNQ, NQ, ES, MES, 6B, 6E, BTC, ETH
- Timeframes: 5m – 1month
- Best For: Intraday context, swing structure, trade planning
💡 Pro Tips for Volume Profile
- Use previous day’s VAH/VAL/POC as today’s key levels
- Watch for rejection off low-volume areas (LVNs)
- Combine with VWAP or Delta for high-confluence setups
🛠️ How to add Volume Profile in NinjaTrader 8?
- Download the pack: HameralOrderFlowIndicatorsPRO.zip
- In NinjaTrader, go to Tools → Import → NinjaScript Add-On
- Select the ZIP file and click Open
- Restart NinjaTrader 8
- Right-click chart → Indicators → Search “Hameral Order Flow Volume Profile PRO”
- Add it to your chart and customize it
📥 Get The Order Flow Basic Pack For FREE
Just sign up for our newsletter and get the full Hameral Basic Order Flow Pack instantly. This includes:
- ✅ Volume Profile Basic
- ✅ VWAP Basic
- ✅ Delta Bars Basic
- ✅ Footprint Basic
- 🎁 Bonus: SperOscillator + Trading Template
💼 Need Advanced Order Flow Tools?
Looking for more flexibility and institutional-grade control? You’ll love the Hameral Pro Order Flow Pack, which includes:
- 📊 Session-by-session & Multi-Timeframe Volume Profiles
- 📌 Anchored Volume Profile
- 📈 Multi-Session VWAP with Standard Deviation Bands
- 📍 Anchored VWAP
- 📉 Cumulative Delta
- 🕯️ Advanced Footprint Chart — visualize order flow inside each candle, including absorption, delta, and more
- ⚡ Super Oscillator PRO with Market Extension Trigger