💡PRO ORDERFLOW PACK
NinjaTrader Order Flow Cumulative Delta Indicator

📌 What is Cumulative Delta?
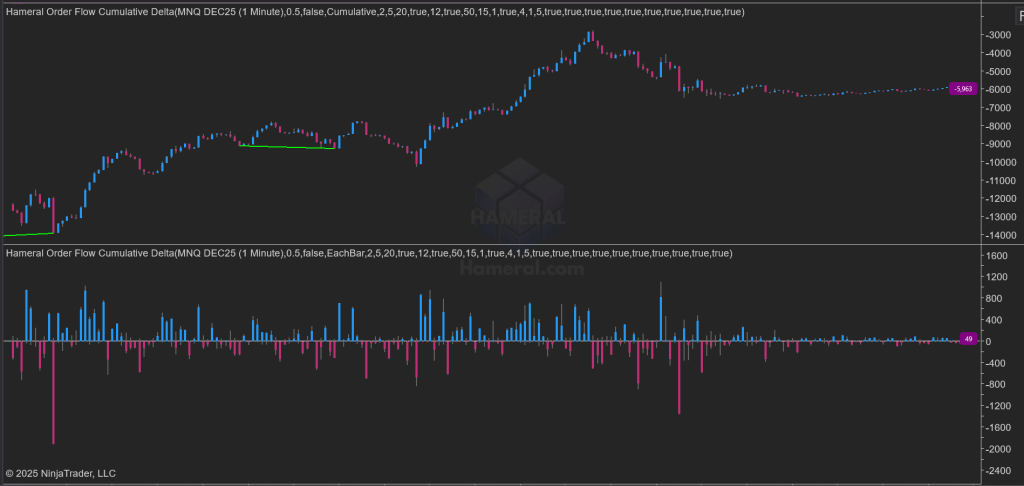
The Hameral Order Flow Cumulative Delta PRO for NinjaTrader 8 reveals real-time buying and selling pressure by plotting cumulative delta candlesticks directly on a subpanel chart.
This powerful tool helps you identify market sentiment shifts, trend confirmation, exhaustion, and divergence by tracking the net volume of buyer vs seller aggression tick-by-tick. Each candle is built from live delta values and reacts to true market activity — not just price movement.
Perfect for order flow scalping, trend continuation confirmation, and fade setups around VWAP or major structure.

🔍 What are the Key Functions fo Cumulative Delta?
🎨 Delta Style
-
Cumulative Session Delta calculates the cumulative delta for the current session. You can choose to reset at each new session or continue calculating across the entire chart.
-
Delta Bar calculates the delta on a bar-by-bar basis.
⚖️ Divergences
There are two types of divergence detection:
1. Final Divergence – This is plotted after a certain number of candles, once the divergence is confirmed. Although it appears later, it still provides valuable insight into the market’s underlying intention.
2. Provisional Divergence – This is a real-time analysis that anticipates potential divergences. Depending on your settings, the provisional divergence will disappear after a set number of candles if the divergence is not confirmed.
This provisional signal acts as an early alert, indicating that price and Cumulative Delta are starting to disagree. It may later develop into a confirmed (final) divergence or simply represent a temporary fluctuation that doesn’t impact the main trend.
1. Confirmed Divergence
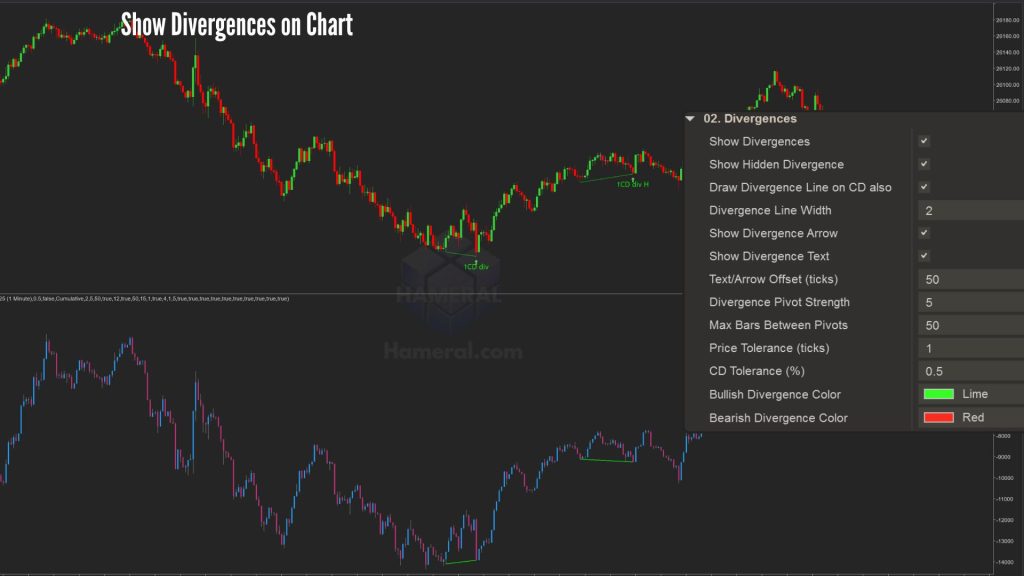
- Choose if you want to show on the chart: Divergence, Hidden Divergence, the divergence line, arrow or text when the divergence happens.
- Divergence calculation settings:
- Divergence Pivot Strenght
The Divergence Pivot Strength setting determines the number of bars on each side of a pivot high or low required to identify a divergence.
For example, the default value is 5. If the indicator detects five candles on the right that are lower and five candles on the left that are lower, it identifies that point as a pivot high (a local peak). The indicator then compares this point with the previous one to determine whether it’s a higher high or a lower high.
The same logic applies to both the price chart and the Cumulative Delta chart. When their behaviors differ – for instance, the price forms higher highs while the Cumulative Delta forms lower highs – the divergence option will highlight this on the chart.
This pivot setting helps filter out noise and focus only on significant market swings.
A higher value means stronger and cleaner divergence signals, but also fewer detections. -
Max Bars Between Pivots acts like a memory limit. It answers the question:
“How far back in time should we look to compare a new price swing with an old one?”As mentioned earlier, a divergence is always a comparison between two points – either two peaks or two valleys. This setting defines the maximum number of bars allowed between those two points.
For example, the default value is 50. This means that if one peak forms and another peak appears within the next 50 candles, the indicator will analyze them to determine whether a divergence exists.
However, if more than 50 candles have passed before a new peak forms, the indicator considers the previous one too old for comparison and ignores it. -
Price Tolerance (in ticks) allows you to give the indicator a bit of flexibility when detecting new highs and lows. Sometimes, strict rules can cause valid divergences to be missed.
Think of this setting as a “close enough” rule for the indicator.
Normally, for a bearish divergence, we look for a higher high in price. But what if the second peak is just slightly lower than the previous one? Without tolerance, the indicator would ignore it.For example, with the default value set to 1 tick, if the price forms a new high that’s just one tick lower than the previous high, the indicator will still treat it as a higher high and include it in the comparison with the Cumulative Delta to determine if a divergence exists.
-
Cumulative Delta Tolerance (in percentage) filters out insignificant differences between the highs and lows of price and Cumulative Delta.
For example, let’s say the price is making higher highs, while the Cumulative Delta is almost flat — forming a slightly lower high. The difference is so small that it doesn’t really represent a meaningful disagreement between price and delta. Should this be considered a strong divergence? No, and that’s exactly why this filter exists.
A tolerance of 0.5% means that the lower high on the Cumulative Delta must be at least 0.5% lower than the previous high value to qualify as a valid divergence.
For example, if the previous high was x, then the new high must be at or below x – (0.5% × x) for the indicator to consider it a significant divergence.
- Divergence Pivot Strenght
- You can choose your favourite colors for Bullish and Bearish divergence.
2. Provisional Divergence
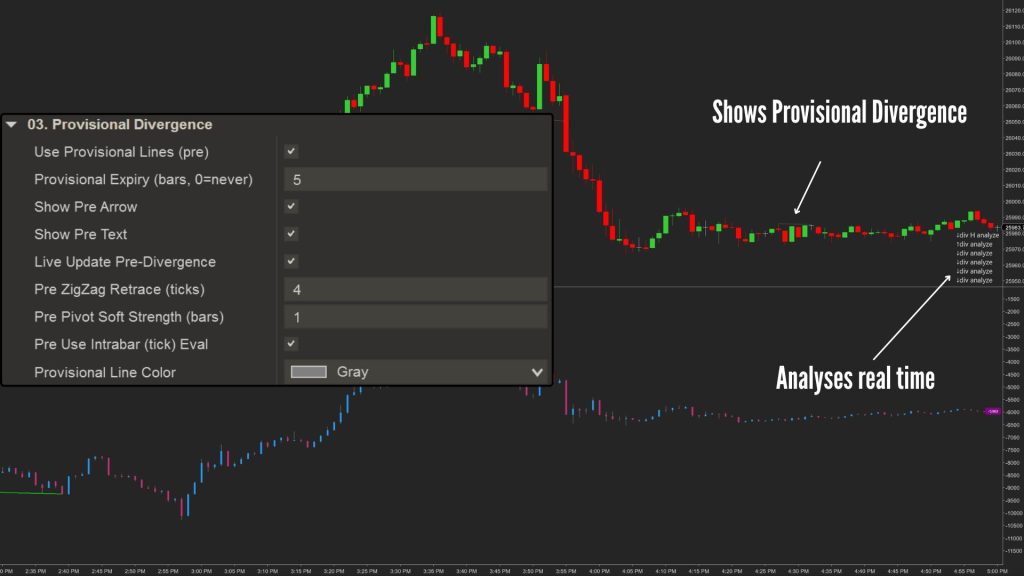
Provisional Divergence allows you to see potential divergences as they start to form.
This divergence is temporary – it will either be confirmed and turned into a fixed divergence, or it will disappear from the chart if not confirmed.
It helps you spot potential divergences earlier and react faster to market changes.
You can customize several options:
-
-
Use Provisional Line – enables the display of provisional divergence lines.
-
Provisional Expiry – Delete After X Candles: automatically removes the provisional divergence if it isn’t confirmed within a set number of candles.
-
Show Arrow and Text – displays visual markers for easier identification.
-
Live Update Pre-Divergence – allows the indicator to update the provisional line after each candle, keeping the information fully dynamic in real time.
-
Pre ZigZag Retrace defines how much the price must move (up or down) before the indicator recognizes it as a true swing rather than just a pause or minor fluctuation.
For example, with the default value set to 4, if the price makes a new high, the indicator monitors the retracement.
If the price pulls back only 1–2 ticks, it treats that movement as noise.
However, if it retraces 4 ticks, the indicator considers it a potential turning point — marking that high as a temporary peak and starting to look for a possible divergence.In short, this setting acts as a noise filter, ensuring the indicator only reacts to significant pullbacks that may signal a change in direction.
-
Pre Pivot Soft Strength (in bars) prevents false signals that may appear when a new high is detected and the price immediately retraces a few ticks (e.g., 4 ticks). This can happen frequently and generate many false pre-alerts.
-
With Pre Pivot Soft Strength = 1, the indicator waits for one full bar to close before officially marking a temporary peak and drawing provisional lines.
-
With Pre Pivot Soft Strength = 2, it waits for two bars to close after the “extreme point.”
-
- Pre Use Intrabar Eval allows the indicator to evaluate provisional lines on every tick when the box is checked.
If unchecked, the evaluation occurs only at each bar close.
-
🎨 Custom Bull/Bear Styling
- Choose distinct colors for bullish and bearish delta candles to instantly recognize buying vs selling pressure.
- Customize the Zero Line color to make delta trend reversals and divergences more visible.
- Supports both light and dark chart themes for clear, contrast-rich visuals.
Personalize the look to fit your trading workspace while making directional bias easy to interpret at a glance.

⚙️ Smart Session Parameters
- Reset on new session — automatically starts fresh delta accumulation each trading day for clean intraday analysis.
- Scale to visible bars — ensures delta values are always adjusted to your zoom level and chart view.
- Padding % — adds vertical space above and below delta bars for better readability without cluttering the chart.
- Show Level Marker – shows you the exact value of Cumulative Delta
- Level Font Size allow you to set the size of the fort for the Level Marker
- Calculate Only The Current Session – either all sessions’ cumulative delta or only the current session.
As you know, when using Tick Replay charts that cover multiple days, the order calculations can be quite heavy and take several minutes to load.
Now, by selecting the Current Session Only option, you can still load multiple days on the chart but calculate data only for the active session, which saves time and keeps the chart lighter and faster.Even so, we don’t recommend using more than 3 days of Tick Replay data, as loading times can still become quite long and may slow down your workspace.
Recommendations:
-
The Cumulative Delta indicator requires a Tick Replay chart.
-
Use a fresh, dedicated chart (no other indicators).
-
We recommend a 1-minute chart with Days to load = 1 (current session only).
🧠 How to Use Cumulative Delta?
The Cumulative Delta shows the running total of aggressive buyers (market buys) minus aggressive sellers (market sells), plotted as a candlestick chart.
- Use delta divergence: If price makes a new high but delta does not, it may signal buyer exhaustion – a possible short.
- Confirm breakouts: A strong push in both price and delta indicates real participation and continuation potential.
- Fade weak moves: If price breaks a level without delta support, consider fading the move.
- Watch the zero line: Crossing above/below it can signal control shift between buyers and sellers.
This tool works great when paired with VWAP, Volume Profile, or major support/resistance levels for high-confluence setups.
🛠️ How to add Cumulative Delta in NinjaTrader 8?
- Download the pack: HameralOrderFlowIndicatorsPRO.zip
- In NinjaTrader, go to Tools → Import → NinjaScript Add-On
- Select the ZIP file and click Open
- Restart NinjaTrader 8
- Right-click chart → Indicators → Search “Hameral”
- Add it to your chart and customize it
📥 Get The Order Flow Basic Pack For FREE
Just sign up for our newsletter and get the full Hameral Basic Order Flow Pack instantly. This includes:
- ✅ Volume Profile Basic
- ✅ VWAP Basic
- ✅ Delta Bars Basic
- ✅ Footprint Basic
- 🎁 Bonus: Super Oscillator + Trading Template
💼 Need Advanced Order Flow Tools?
Looking for more flexibility and institutional-grade control? You’ll love the Hameral Pro Order Flow Pack, which includes:
- 📊 Session-by-session & Multi-Timeframe Volume Profiles
- 📌 Anchored Volume Profile
- 📈 Multi-Session VWAP with Standard Deviation Bands
- 📍 Anchored VWAP
- 📉 Cumulative Delta
- 🕯️ Advanced Footprint Chart — visualize order flow inside each candle, including absorption, delta, and more
- ⚡ Super Oscillator PRO with Market Extension Trigger