💡Hameral Big Trades Bubble
Hameral Big Trades Bubble Indicator for NinjaTrader 8

Hameral Big Trade Orders Bubble – Overview
Hameral Big Trade Orders Bubble is designed to show you something the chart normally hides:
where big traders are actually placing their orders. Instead of guessing who is in control,
you literally see it on the candles through clean, simple bubbles.
Whenever a large group of orders hits the market fast, or a single big order smashes into the bid or ask, the indicator detects it and drops a bubble right on the chart.
Buy bubbles show aggressive buyers stepping in; sell bubbles show aggressive sellers taking control.
It does this using four different detection modes:
- fast sweeps,
- same-price aggression,
- stacked volume at a single level,
- single big prints.
This lets you understand not just that volume happened, but how it happened.
Why it matters
Seeing big orders in real time gives you a huge advantage because those orders often appear at
key turning points, breakouts, fakeouts, and defended levels.
When you see a bubble at support, resistance, or on a pullback, you instantly know whether buyers or sellers
are really stepping in – not just what the candle shape suggests.
- Spot real aggression: find out who is actually pushing the market, buyers or sellers.
- Read reversals better: bubbles at the extremes often reveal exhaustion or absorption.
- Catch continuation trades: bubbles on pullbacks show where big players defend the move.
- Remove the noise: filters let you keep only the meaningful big-order events.
In short, this indicator helps you see the hidden battle behind every candle.
Whether you scalp, day trade, or swing trade, the bubbles help you understand what the big players
are doing, and that information can completely change how you read the market.

🔍 Key Functions
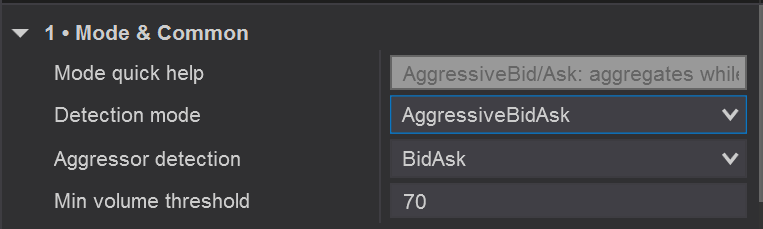
1. Mode & Common
Mode & Common let you decide the bubble type.
Detection mode
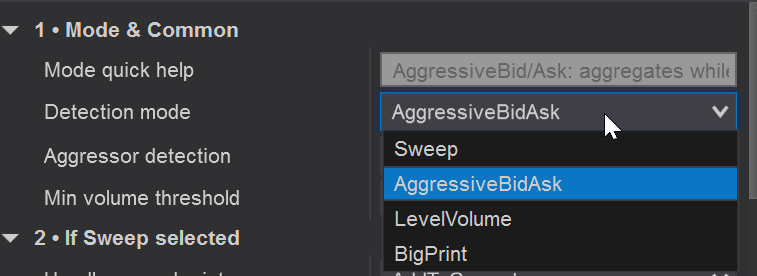
Detection mode
This is where you choose how the indicator detects big trades.
This setting tells the indicator what type of big-order behavior you want to catch.
There are 4 modes and each mode works differently:
- AggressiveBidAsk
Groups trades that hit the bid or ask and shows a bubble only when the bid or ask volume is bigger than your Min Volume Threshold, while the inside price (best bid/ask) stays the same.
Great for spotting absorption, trap conditions, and same-level aggression.

- Sweep Mode
Detects fast sequences of trades that hit the market within a very short time window, across one or multiple price levels. This mode shows when buyers or sellers strike aggressively in milliseconds, revealing true momentum bursts.
Sweep Mode includes many customizable parameters so you can fine-tune how sensitive it is to speed, price movement, and volume conditions.

- LevelVolume
Shows heavy volume stacked at a single price level, regardless of speed.

- BigPrint Mode
Detects a single large order that hits the tape in one shot.

Aggressor detection
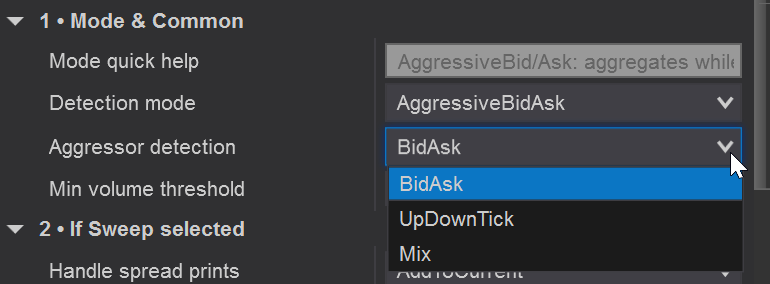
This setting tells the indicator how to decide whether a trade is an aggressive buy or an aggressive sell. There are three methods:
- BidAsk
The most accurate method when your data feed provides reliable bid/ask updates.
Trades hitting the ask are classified as aggressive buys, and trades hitting the bid are classified as aggressive sells. - UpDownTick
Uses price movement instead of bid/ask quotes.
If the price ticks up, trades are treated as buys; if the price ticks down, trades are treated as sells. Useful when bid/ask data is incomplete. - Mix
Automatically uses BidAsk when available and falls back to UpDownTick when bid/ask data is missing or unstable. This gives the most robust classification across all markets.
Recommended: In most cases, Mix offers the best and most reliable result. If you know your data feed provides excellent bid/ask information, you can use BidAsk directly. Use UpDownTick only if your feed struggles with bid/ask updates.
Min volume threshold
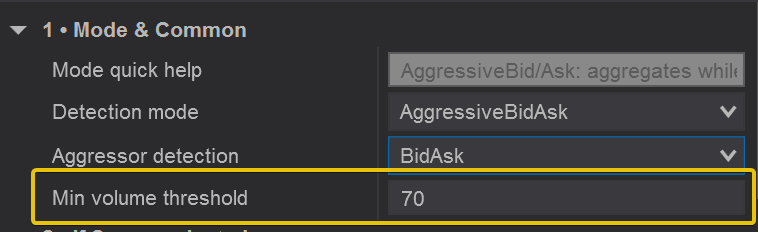
This is the minimum volume needed to form a bubble.
Example:
If you set this to 70, then:
A sweep,
A same-level aggressive event,
A big print,
Or a single price-level cluster
…must contain at least 70 contracts to show a bubble.
If the detected event is smaller than 70 → no bubble appears.
In simple words:
This filters out small trades so you only see meaningful size from big participants.
Section 2 – If Sweep Selected
This section contains all the settings that control how Sweep Mode detects fast, aggressive sequences of trades – including timing, price-range sensitivity, DOM behavior, and advanced filters that help you isolate only the strongest sweep events. ❗It is working only when the sweep mode is selected.
Handle spread prints
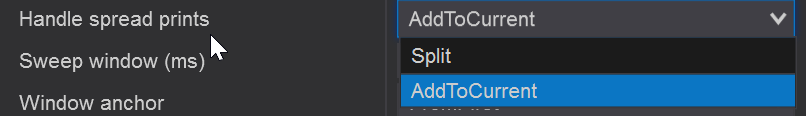
This setting controls how the indicator treats trades that happen across more than one price level at the same time (spread trades). These can appear when large orders get filled in multiple price levels instantly.
- Split
Treat each price level separately – the sweep is split into multiple small parts. Use this if you want very strict, price-level-accurate sweep detection. - AddToCurrent
Combine spread prints into the current sweep group – even if they hit multiple levels at once. This makes the sweep more continuous and is usually better for understanding strong, fast aggression.
In simple words:
Choose Split for cleaner, level-by-level precision, or choose AddToCurrent if you want the indicator to treat multi-level fills as part of one strong sweep.
Sweep window (ms)
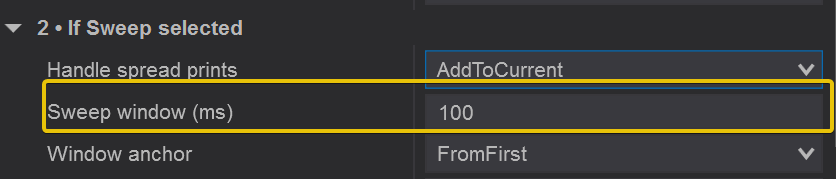
This controls how much time the indicator has to group trades together into one sweep. The shorter the window, the faster the trades must occur to be considered a single aggressive sweep.
- Smaller value (e.g., 20–50 ms)
Only extremely fast, high-intensity sweeps will be detected. Good for very strict signals. - Larger value (e.g., 80–150 ms)
Allows more trades to be grouped together, even if there is a slight delay between them. Good for smoother, more realistic sweep detection on slower markets.
In simple words:
This setting tells the indicator: “If aggressive trades happen within this many milliseconds, treat them as one sweep.” A larger window = more grouping, a smaller window = more precision.
Opposite tolerance (ticks)

This setting controls how much opposite-side activity is allowed during a sweep. A sweep should be mostly one-sided aggression, but sometimes a few small trades hit the other side while the sweep is happening. This parameter defines how many ticks of opposite prints the indicator will tolerate before breaking the sweep.
- Lower value (0–1 ticks)
Only pure, one-direction sweeps are allowed. Even small opposite prints will stop the sweep. Best for very strict detection. - Higher value (2–3+ ticks)
Allows occasional opposite-side trades during the sweep. Useful in fast markets where micro back-and-forth happens even during strong aggression.
In simple words:
This defines how “clean” the sweep must be. A small tolerance accepts only pure aggression; a bigger tolerance allows small opposite trades but still treats the move as one sweep.
Minimum sweep range (ticks)
This sets the minimum price distance a sweep must cover for a bubble to appear. A sweep that stays inside a tiny 0–1 tick area might just be noise, so this parameter helps you ignore very small movements.
- 0 ticks
No minimum distance. Even sweeps that stay at a single price level can trigger a bubble. - 1–2 ticks
Require the sweep to move through multiple price levels before it is considered meaningful. Good for avoiding micro-noise. - 3+ ticks
Only show sweeps that push strongly through several ticks. Ideal for detecting real momentum or aggression.
In simple words:
This controls how much price movement a sweep must have.
No movement = every sweep counts.
More movement required = only stronger, more impactful sweeps show bubbles.
Require market-at-best
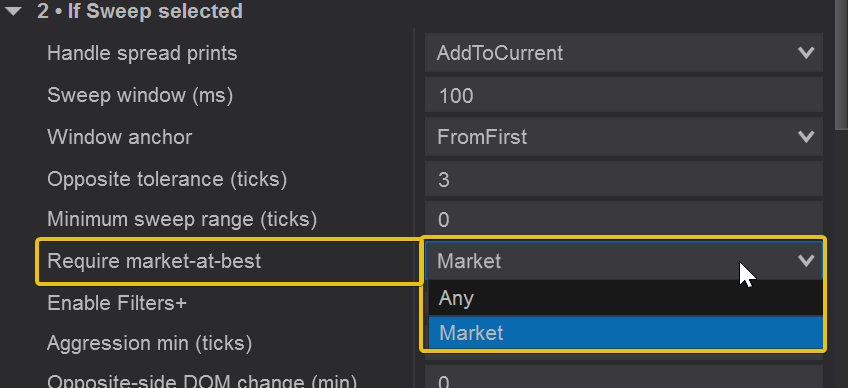
This setting decides whether the sweep must be made of pure market orders hitting the best bid or best ask. It controls how strict the indicator is about what counts as “true aggression.”
- Market
Only includes trades that hit the current best bid or best ask.
This ensures the sweep represents real, aggressive market orders.
Good for clean, high-quality signals. - Any
Allows trades even if they don’t hit the best price (e.g., trades executed off the inside market).
More inclusive, but can show weaker or less meaningful sweeps.
In simple words:
“Market” gives you pure aggression (recommended for most traders).
“Any” is more relaxed and may include less aggressive prints.
Filters+ (Advanced Sweep Filtering)
Filters+ is an advanced set of conditions that helps you show only the highest-quality sweeps.
Instead of displaying every burst of fast trades, Filters+ checks the strength, effectiveness, and liquidity impact of the sweep.
If a sweep doesn’t meet the criteria you set, no bubble will be shown – this keeps your chart clean and focused on truly meaningful order-flow events.
Below is what each filter does:
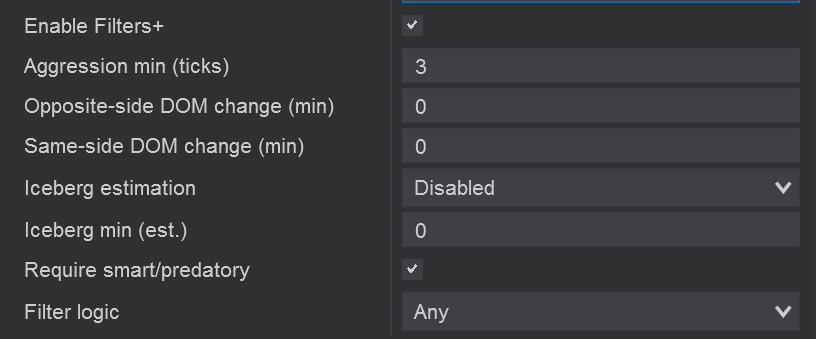
- Aggression min (ticks)
Requires the sweep to move the market a minimum number of ticks in the direction of the aggression.
This ensures you only see sweeps that actually moved price, not small bursts of noise. - Opposite-side DOM change (min)
Measures how much liquidity was eaten on the opposite side of the book during the sweep.
A higher number means the sweep consumed real liquidity – a sign of strong, meaningful aggression. - Same-side DOM change (min)
Checks if additional liquidity appeared on the same side (reloads or iceberg-style refills).
This helps identify hidden orders supporting the sweep – especially useful for absorption. - Iceberg estimation
Attempts to detect possible iceberg orders through DOM refill behavior.
When enabled, you can filter for sweeps that interacted with hidden liquidity. - Iceberg min (est.)
Sets the minimum estimated iceberg size required for the sweep to qualify.
Helps you isolate sweeps that hit large hidden buyers or sellers. - Require smart/predatory
When enabled, the sweep must fully deplete opposite liquidity at least once.
This identifies the most aggressive, “smart money” sweeps – the ones that truly attack liquidity. - Filter logic (Any / All)
– Any: If at least one filter passes, the sweep is accepted.
– All: All selected filters must pass for the bubble to appear.
This gives you full control over how strict the Filters+ system should be.
In simple words:
Filters+ lets you ignore weak sweeps and highlight only the strong, clean, high-probability order-flow events where big traders were truly active.
3 • If AggressiveBidAsk selected
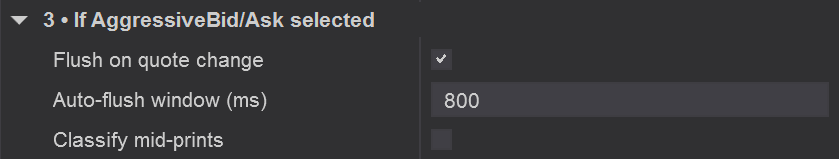
This section contains the settings that control how the indicator handles trades when you use the AggressiveBidAsk detection mode. These tools help you decide when the bubble should be finalized and how to classify trades that are not perfectly at the bid or ask.
Flush on quote change
When enabled, the sweep (or group of same-level trades) is immediately finalized as soon as the inside bid or ask price changes.
This ensures the bubble represents only trades that happened while the best bid/ask stayed the same — which is the core idea of AggressiveBidAsk mode.
In simple words:
If the bid/ask moves → the bubble closes right away.
Auto-flush window (ms)
This sets a maximum time limit for grouping trades at the same bid/ask price.
If no new qualifying trades arrive within this time window, the indicator automatically finalizes the bubble.
- Smaller value (200–400 ms): very strict grouping, only ultra-active sequences are kept together.
- Larger value (600–1200 ms): allows slower sequences to be grouped as one bubble.
In simple words:
“If nothing else happens for X milliseconds, finish the bubble.”
Classify mid-prints
Sometimes trades occur between the bid and ask (mid-prints).
They don’t clearly belong to either side, so this setting tells the indicator what to do with them.
- Checked: Mid-prints are included and classified using your aggressor method (BidAsk, UpDownTick, Mix).
- Unchecked: Mid-prints are ignored and do not affect bubbles.
In simple words:
Enable this if you want the indicator to make a decision about mid-prints.
Disable it if you want only pure bid/ask aggression.
4 • If LevelVolume selected
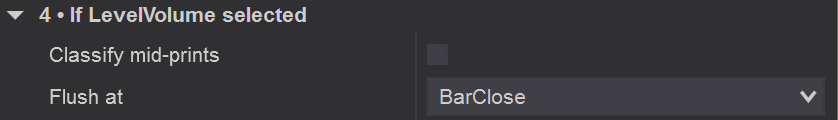
These settings control how the indicator detects and groups volume when you’re using the LevelVolume detection mode.
LevelVolume focuses on all volume traded at a single price level inside a bar — not speed, not sweeps, just raw size at one price.
Combine mode
This decides whether the indicator should combine multiple hits at the same price level throughout the bar.
- On
All volume at that level (both aggressive and passive) gets added together. Best for seeing big clusters of activity. - Off
Only individual prints are evaluated. Useful if you want to detect single big events rather than accumulated volume.
In simple words:
“On” = group all trades at that price.
“Off” = treat each print separately.
Anchor
Controls where the bubble is drawn relative to the bar:
- High
Places the bubble at the top of the bar. - Low
Places the bubble at the bottom of the bar. - PriceLevel
Places the bubble exactly at the price level where the heavy volume occurred.
In simple words:
Choose where you want the bubble to appear based on your chart style.
Include both sides
This tells the indicator whether to evaluate total volume (bid + ask combined) or only the aggressive side.
- Checked: Uses total volume at the level. Best for identifying big participation zones.
- Unchecked: Uses aggressive volume only. Ideal when you want clean buy/sell signals.
In simple words:
Check it for total volume, uncheck it for pure aggression.
Require single-price-only
When enabled, the bubble only appears if the entire volume cluster happened at one exact price level with no trades at neighboring ticks.
- On: Filters to only very clean, isolated price-level clusters.
- Off: Allows clusters even if some trades hit nearby ticks.
In simple words:
Enable for strict clusters, disable for more inclusive cluster detection.
5 • If BigPrint selected
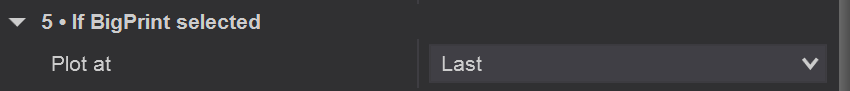
When you choose BigPrint as the detection mode, the indicator stops looking for sweeps or clustered volume and
focuses only on single large trades.
Every individual print is checked on its own, and if that one trade is bigger than your
Min volume threshold, a bubble is plotted immediately at that price.
There is no time window or price-range grouping in this mode – BigPrint simply answers the question:
“Did a single big order just hit the market here?”
This makes it perfect for spotting sudden institutional entries or exits, exhaustion spikes,
and key reaction prints around important levels.
In simple words:
BigPrint mode shows a bubble for each single trade that is large enough,
ignoring all smaller prints and without grouping them together.
Last selected
This section controls how the bubble is positioned on your chart when the indicator finishes processing
a sweep, aggressive sequence, level-volume event, or a big print.
It does not change detection — it only changes where the bubble appears.
6 • Appearance
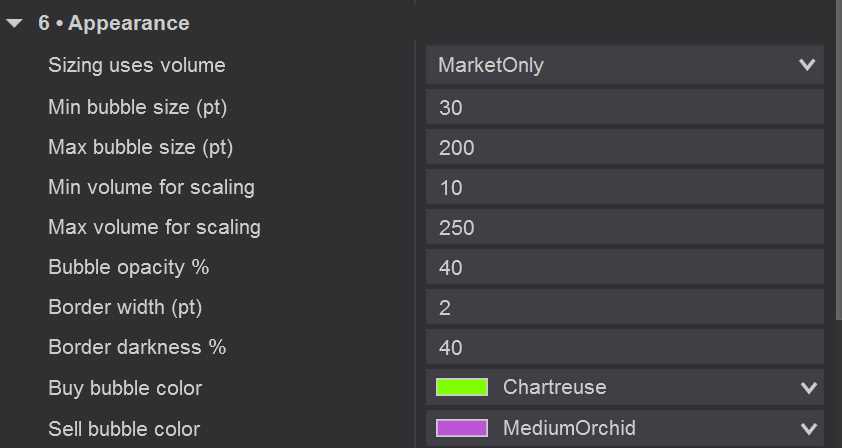
This section controls how the bubbles look and scale on your chart.
It does not change detection — only the visual appearance.
These settings help you customize bubble size, color, transparency, and how volume affects bubble scaling.
Sizing uses volume
Decides which type of volume is used to calculate bubble size:
- MarketOnly
Only aggressive volume (market orders) affects bubble size. Best for clean buy/sell signals. - Total
Uses all volume (bid + ask combined) for scaling. Good for LevelVolume mode.
In simple words:
This decides whether bubble size should depend on aggressive or total volume.
Min bubble size (pt)
The smallest size a bubble can appear.
Even small events that pass your thresholds will use at least this size.
Max bubble size (pt)
The largest possible bubble size.
Very big volume events will be capped at this limit.
In simple words:
These two values define your visual range from the smallest to the largest bubble.
Min volume for scaling
The minimum volume that maps to your Min bubble size.
Any volume below this number will produce the smallest bubble.
Max volume for scaling
The volume amount that maps to your Max bubble size.
Any volume above this number will produce the largest bubble.
In simple words:
This sets the volume-to-bubble-size relationship.
Lower volume = small bubble. Higher volume = big bubble.
Bubble opacity %
Controls how transparent or solid the bubbles appear.
Lower values = more transparent.
Higher values = more visible and solid.
Border width (pt)
The thickness of the bubble’s outline.
Border darkness %
Controls how dark the bubble’s outline is.
Useful for making bubbles pop on bright or dark chart backgrounds.
In simple words:
These let you fine-tune how bold or subtle your bubbles look.
Buy bubble color
Color of bubbles that represent aggressive buyer activity (ask-side).
Use a color that stands out clearly — e.g., bright green.
Sell bubble color
Color of bubbles that represent aggressive seller activity (bid-side).
Use a color that contrasts with your buy color — e.g., purple or red.
In simple words:
Choose the colors that best match your chart theme and make reading aggression easy.
7 • Labels & Details
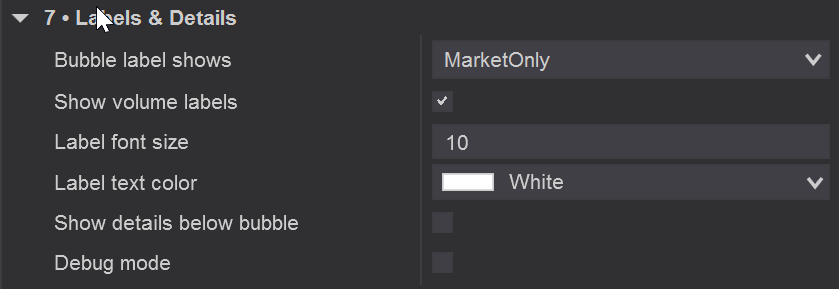
This section controls what text appears inside and around the bubbles.
It helps you customize how much information is shown so your chart stays clean or detailed based on your preference.
Bubble label shows
Decides what type of volume the label inside the bubble should display:
- MarketOnly
Shows only the aggressive part of the order (market buys or market sells).
Best for clean buy/sell signal interpretation. - Total
Shows the total volume behind the event (bid + ask combined).
Useful in LevelVolume or BigPrint mode.
In simple words:
Choose what number you want to see printed inside the bubble.
Show volume labels
Enables or disables the text inside the bubble.
If unchecked, bubbles appear with no numbers — a cleaner visual style.
In simple words:
Turn this on if you want to see volume, turn it off if you want minimal visuals.
Label font size
Controls the size of the text inside the bubble.
Use a larger font on high-resolution monitors or smaller fonts for a more subtle look.
Label text color
Sets the color of the text inside the bubble.
Pick a color that contrasts well with both your chart background and bubble colors.
Show details below bubble
When enabled, the indicator shows additional information under the bubble, such as sweep range, iceberg estimate, DOM pressure, and other advanced metrics (depending on detection mode).
Great for power users who want deeper context.
In simple words:
Enable this if you want extra stats under the bubble.
Debug mode
Shows internal calculations, intermediate values, and diagnostic info directly on the chart.
This is mainly for advanced users or development/testing.
In simple words:
Turn this on only if you are troubleshooting or exploring how the indicator works internally.
8 • Placement & Limits
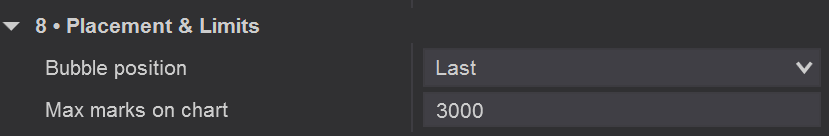
This section controls where bubbles are placed on your chart and how many can be drawn at once.
It helps you keep your chart readable and ensures good performance even during heavy activity.
Bubble position
Decides the exact price level where each bubble will be anchored.
- Last
Places the bubble at the last traded price within the detected event.
This gives the most precise placement for entries and exits. - HighLow
Places buy bubbles at theof the event
and sell bubbles at the lowest traded price.
Helpful when sweeps run through multiple levels and you want a cleaner look.
In simple words:
“Last” = exact final trade level.
“HighLow” = bubble at the extreme of the move.
Max marks on chart
Sets the maximum number of bubbles that can be displayed at the same time.
This prevents your chart from becoming overloaded during high-volume sessions.
- Larger numbers (e.g., 2000–5000) show more historical bubbles.
- Smaller numbers (e.g., 300–800) keep charts clean and improve performance.
In simple words:
This is a safety limit so your chart never gets cluttered or slows down.
Frequently Asked Questions (FAQ)
Does the indicator work in real time and historical data the same way?
Not exactly. Real-time detection is always the most accurate because the platform receives the true timing
and sequencing of trades. Historical data can approximate sweeps and aggression (especially with Tick Replay),
but micro-timing inside milliseconds cannot be perfectly reconstructed.
Real time = 100% accurate.
Historical = best effort, but not identical.
Why do bubble volumes sometimes differ from the footprint or tape?
Because the indicator only counts trades that meet the selected mode and filters.
For example, in Sweep Mode, only trades within the sweep window are included.
In AggressiveBidAsk mode, only same-level aggressive trades count.
In BigPrint mode, only the single largest print is displayed.
This is normal and expected.
Which detection mode should I use?
It depends on what you want to see:
- Sweep Mode – fast aggression, momentum bursts, liquidity grabs.
- AggressiveBidAsk – same-level absorption, traps, defended levels.
- LevelVolume – price levels where size stacked up.
- BigPrint – single huge trades, exhaustion, iceberg hits.
If you’re unsure, start with AggressiveBidAsk or Sweep Mode.
What aggressor detection setting should I use?
In most cases, Mix is the safest and most reliable option.
If your data feed provides excellent bid/ask updates, BidAsk is ideal.
Use UpDownTick only if bid/ask data is incomplete.
Does the indicator work on any market?
Yes. It works on futures, indices, crypto, and forex – as long as your data feed provides
tick-by-tick execution data.
For markets with very fast tape (like NQ or ES), adjust thresholds higher.
How should I choose my Min Volume Threshold?
Use the following general guidance for all the modes except VolumeLevel:
- Fast markets (NQ, ES, RTY): 60–150
- Medium markets (CL, GC, currencies): 30–80
- Slow markets: 10–40
Increase it to reduce noise. Decrease it to see more bubbles.
Why do some sweeps not produce bubbles?
This can happen if:
- The sweep does not meet your volume threshold.
- Opposite-side tolerance is too strict.
- Filters+ blocked the event (DOM pressure, iceberg, aggression minimum).
- The sweep didn’t move price enough (minimum range).
- Market-at-best was required, but the prints were off the inside market.
Adjust thresholds and Filters+ settings to fine-tune.
Why do some bubbles appear slightly late?
This is normal. The indicator waits for a sweep or aggressive sequence to finish before plotting the bubble.
This ensures accuracy — not premature signals.
Does the indicator repaint?
No. Once a bubble is placed, it never moves or recalculates.
Historical bubbles may differ slightly from real time due to Tick Replay limitations,
but bubbles do not repaint during real-time use.
What settings improve performance?
To keep NinjaTrader fast:
- Lower Max marks on chart (e.g., 1500).
- Increase Min volume threshold.
- Disable Debug mode.
- Keep Show details below bubble off unless needed.
Can I use it on Renko, Range or Tick charts?
Yes — these chart types work very well with order flow.
Sweeps and big prints often stand out even more clearly.
How do I know if a bubble is buy or sell?
You choose the colors:
- Buy bubble color = aggressive buyers (ask hits).
- Sell bubble color = aggressive sellers (bid hits).
The bubble color is always based on the Aggressor Detection method.
Why do bubbles disappear when zooming out?
If you have too many bubbles on the chart, NinjaTrader limits rendering to maintain performance.
Increase the Max marks on chart value to show more.
Should I use Filters+?”
If you want only clean, meaningful, high-quality sweeps, yes.
If you want to see everything (even small or sloppy sweeps), leave Filters+ off.
Do bubbles predict future price direction?
Not directly. They show where big traders acted.
You still need context — structure, trend, liquidity zones — to interpret them.
Used correctly, they help you identify:
- Exhaustion at highs/lows
- Absorption and traps
- Momentum continuation
- Liquidity grabs
Why do bubbles appear on wicks?
Because the bubble is anchored to the exact price where the trades occurred.
Bubbles reflect tape activity, not candle body positions.
Does the indicator show iceberg orders?
Yes – if you enable Iceberg estimation inside Filters+.
The indicator detects liquidity refills that signal potential hidden size.
Does the indicator affect performance?
Only slightly. Sweep Mode and Filters+ require more processing, but with reasonable settings
the indicator runs smoothly on modern machines.
If your PC struggles, lower the bubble limit, thresholds, or Filters+ requirements.
🛠️ How to Install it in NinjaTrader 8
- Download the indicator
- In NinjaTrader, go to Tools → Import → NinjaScript Add-On
- Select the ZIP file and click Open
- Restart NinjaTrader 8
- Right-click chart → Indicators → Search for the indicator
- Add it to your chart and customize it
🛠️ How to add the templates in NinjaTrader 8
- Close the platform.
- Unzip the folder containing the templates.
- Copy the XML files (for example: “Hameral Big Trades Bubble Green Purple Temp ES 1min.xml”, “Hameral Big Trades Bubble Green Purple Temp MNQ 1min.xml”, etc.).
- Open the NinjaTrader 8 folder (usually located in Documents) → go to Templates → Chart. Paste the templates there.
- Open the platform.
- Open a new chart → right-click → Load → select the desired template.
Recommended Settings
If you’re just getting started, we strongly recommend beginning with
AggressiveBidAsk mode. It is the most intuitive and reliable way to see where
real, same-level buying or selling aggression is happening.
This mode is excellent for identifying:
- Absorption (big traders defending a price)
- Trap conditions (late buyers or sellers stuck)
- Aggressive reactions at support or resistance
- Strong continuation or breakdown moments
It gives very clean signals, requires minimal tuning, and works well on any market.
Below are some recommended starter settings for popular futures instruments.
You can always adjust (up or down) based on how many bubbles you want to see.
📌 Recommended Settings for MNQ (Micro Nasdaq)
- Detection mode: AggressiveBidAsk
- Min volume threshold: 50-100
- Sweep window: 80–120 ms (if using Sweep later)
- Aggressor detection: BidAsk
- Sizing uses volume: MarketOnly
Why: MNQ has smaller contract size, so the prints are naturally lighter.
Thresholds above ~50 may filter out too much real activity.
📌 Recommended Settings for NQ (Nasdaq)
- Detection mode: AggressiveBidAsk
- Min volume threshold: 60–120
- Sweep window: 80–120 ms
- Aggressor detection: BidAsk
Why: NQ trades fast and prints come in bursts.
A threshold in the 60–120 range filters noise while still capturing the important aggression.
📌 Recommended Settings for ES (S&P 500)
- Detection mode: AggressiveBidAsk
- Min volume threshold: 80–150
- Sweep window: 100–150 ms
- Aggressor detection: BidAsk (ES feed is cleaner)
Why: ES has deeper liquidity, so real aggression is usually 80+ contracts.
Large volume clusters matter more than rapid bursts.
📌 Recommended Settings for GOLD (GC)
- Detection mode: AggressiveBidAsk
- Min volume threshold: 30–70
- Sweep window: 120–180 ms
- Aggressor detection: Mix
Why: GOLD trades in pulses and often sweeps slower.
A slightly wider sweep window (120–180 ms) catches these more naturally.
General Advice
- If you see too many bubbles: increase the Min Volume Threshold.
- If bubbles rarely appear: lower the threshold or loosen Filters+.
- Use Mix for aggressor detection unless you are certain your data feed has perfect bid/ask updates.
- During news events: raise the threshold — volatility inflates prints.
- For scalping: use stricter filters and smaller sweep windows.
- For swing or slower charts: use a slightly higher threshold and bigger sweep windows.
The goal is not to see every bubble — it’s to see the meaningful ones.
Start simple, watch how the bubbles interact with structure, and adjust thresholds based on your instrument’s rhythm.