💡FREE BASIC ORDERFLOW PACK
Ninja Trader Order Flow Footprint Indicator

📌 Overview
The Hameral Order Flow Footprint PRO for NinjaTrader 8 gives you powerful x-ray vision into each candle by displaying the actual bid/ask volume at every price level – inside the candle itself.
With advanced settings for footprint layout, imbalance highlighting, delta analysis, and bar filtering, this tool helps you detect order flow absorption, trapped traders, and high-conviction breakouts in real time.
Ideal for scalpers and intraday traders looking for precise entry and exit confirmation using raw market aggression.
🔍 Key Functions
📍 Absorption Zones
- Absorption Percent
- What it means: The percentage of market orders that must be absorbed by limit orders at a price level.
- Example: A setting of
70means that at least 70% of incoming market orders are being absorbed, not pushing the price further. - Purpose: Helps identify areas where big players are absorbing pressure (either buys or sells), indicating hidden liquidity.
- Consecutive Levels
- What it means: How many price levels in a row (vertically) need to meet the absorption condition to form a zone.
- Example: If set to
1, a single price level is enough. If set to3, three stacked price levels must meet the absorption rules to trigger a zone. - Purpose: Filters out random spikes and only shows more structural absorption areas.
- Absorption Depth (Ticks)
- What it means: How far (in ticks) from the current price to look up/down for absorption.
- Example: If set to
2, the indicator checks 2 ticks above or below for signs of absorption. - Purpose: Allows you to tune sensitivity—lower values = closer to current price, higher = more relaxed detection range.
- Absorption Volume Filter
- What it means: The minimum traded volume at the level(s) to consider it significant absorption.
- Example: If set to
20, absorption zones will only appear where at least 20 contracts were traded. - Purpose: Avoids showing low-volume noise or micro-structure data that isn’t tradable.
Visual Output: Colored zones (Red for sell absorption, LimeGreen for buy absorption) with customizable opacity, clearly marking battle zones between buyers and sellers.


📊 Delta Histogram
Visually displays the delta (difference between aggressive buys and sells) per candle in a clean histogram format. Helps spot real-time volume imbalances instantly.
- Customize width, offset, and thickness
- Enable/disable anytime

🧾 Delta Info Panel
Compact delta dashboard showing detailed candle statistics:
- Total delta, volume, max/min delta
- Delta change and session delta
- Full styling options: font size, text color, cell separators, row height


🖥 Display
Choose what you see and how it looks:
- Font size control for numbers
- Volume display format
- Show historical bars and control how many to render

🎯 Filtering
Filter out noise using minimum volume thresholds. Only show meaningful data with real significance. Only display bid/ask volume if it’s above a certain threshold (e.g., 20 contracts).

📐 Footprint Position
Control exactly where the footprint is displayed on the chart:
- Offset position right
- Auto scale with zoom
- Scale factor for footprint size

🎨 Footprint Style
Customize your chart’s look with precision:
- Bid/Ask colors
- Delta background highlight with adjustable opacity
- Optional POC outline and customizable POC color

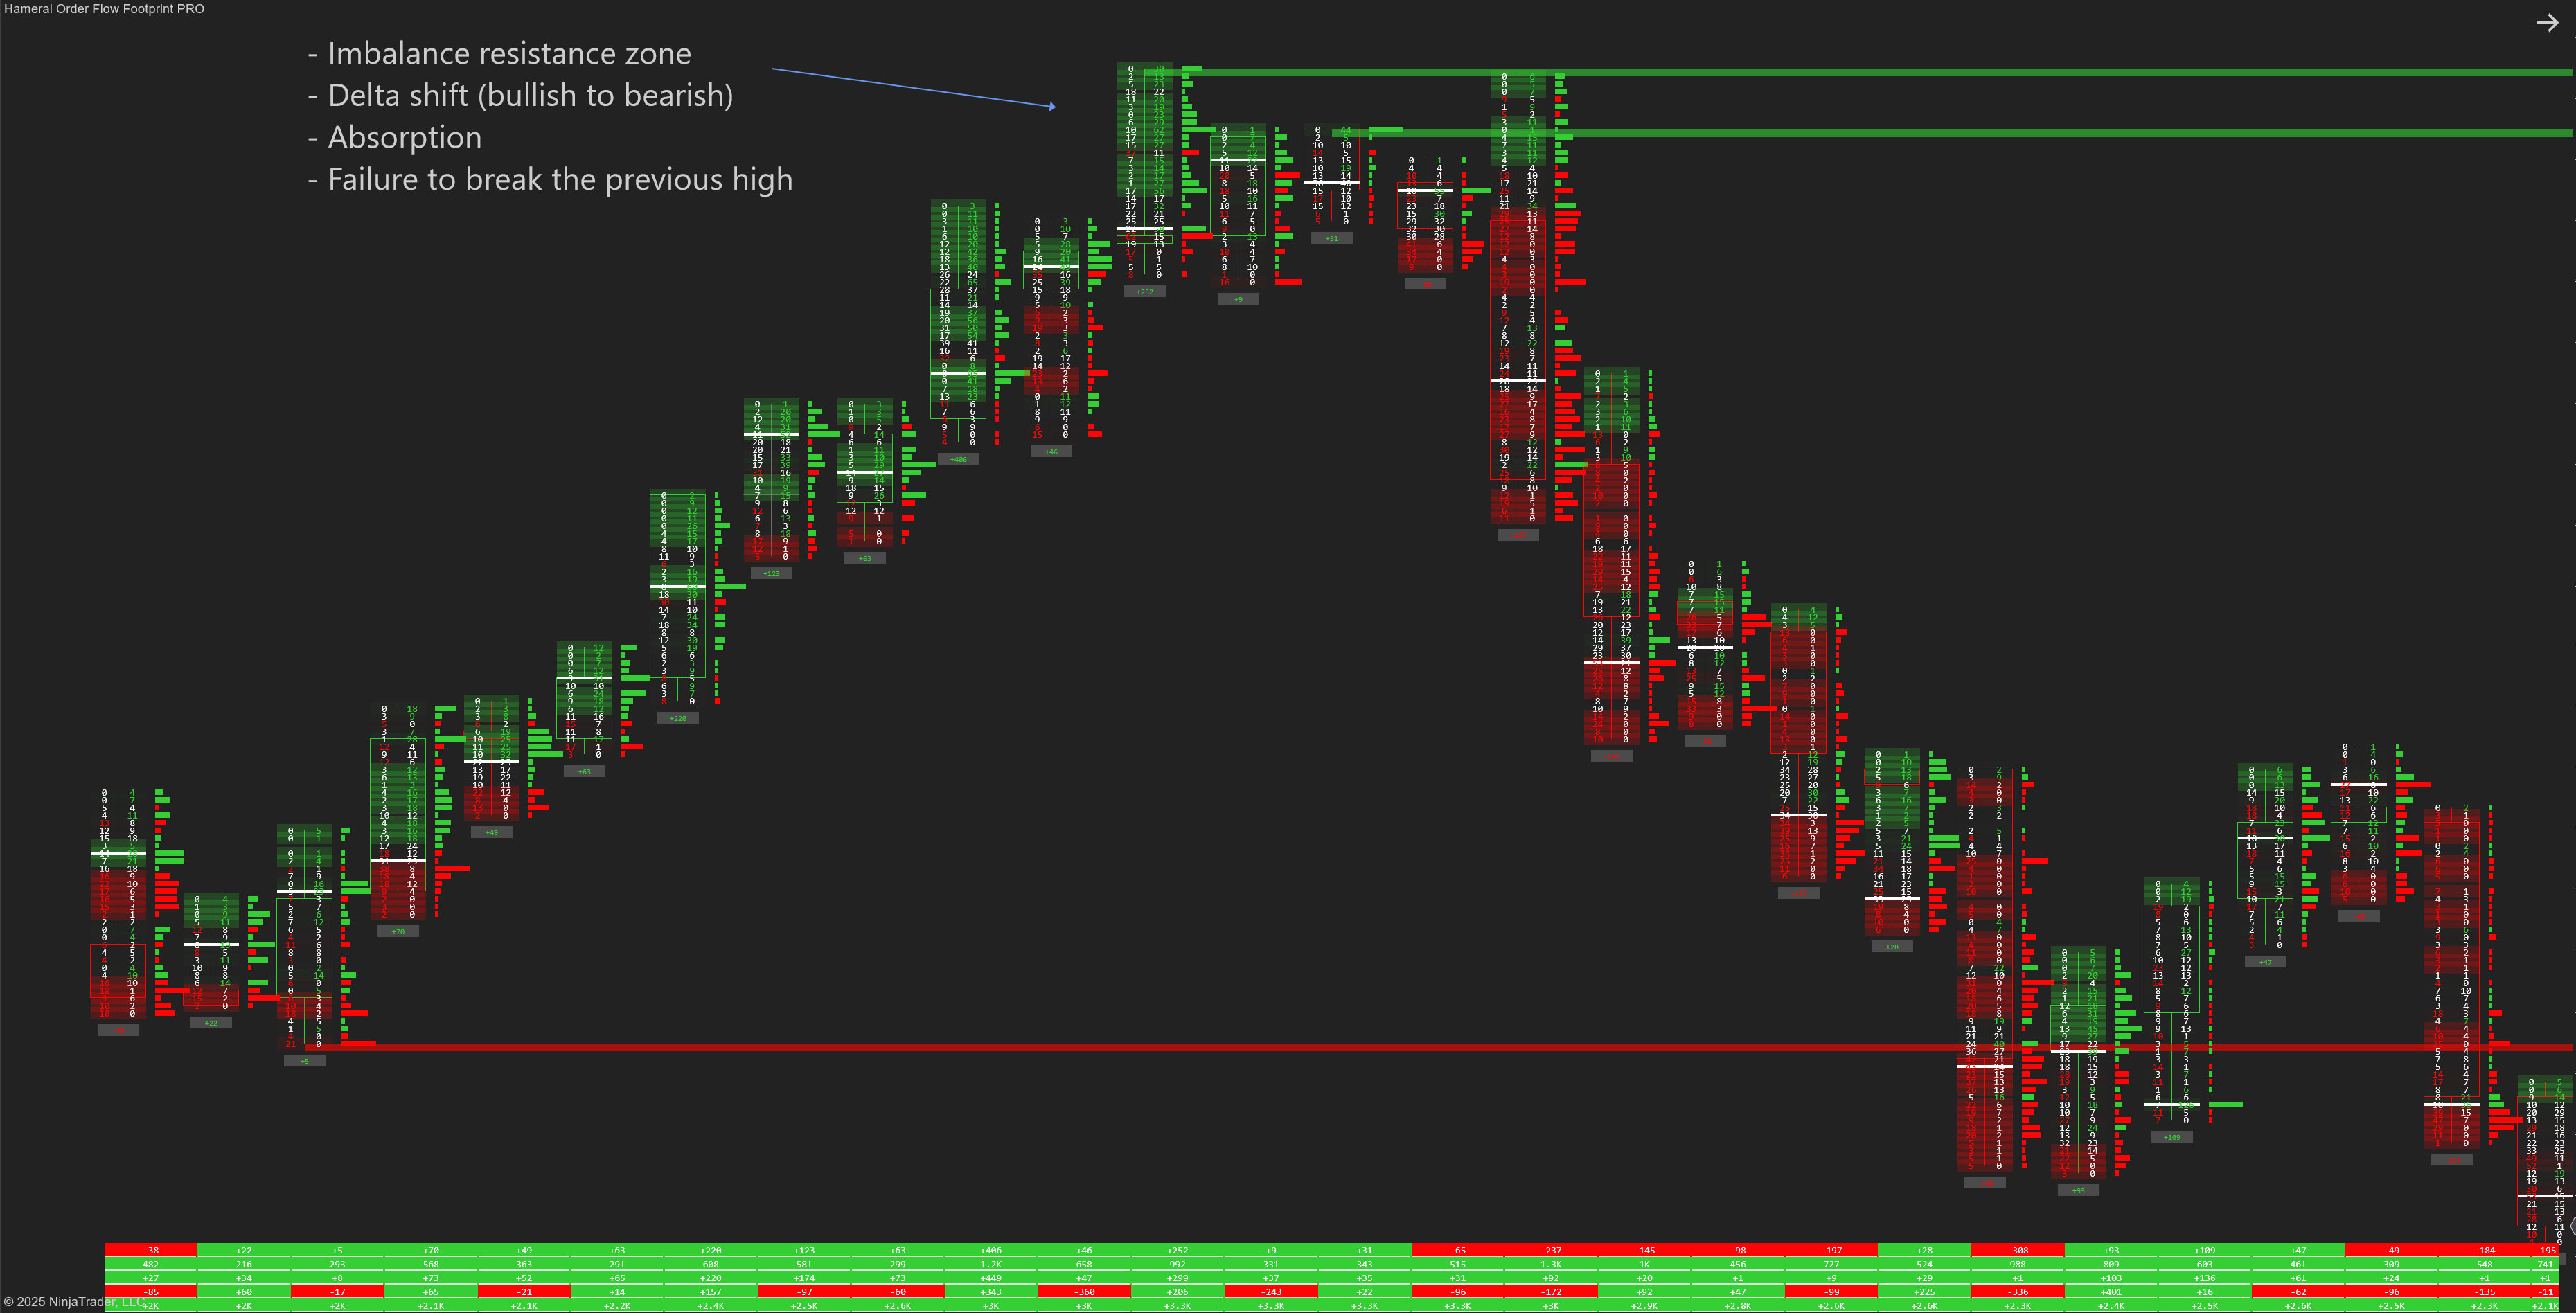
🚨 Imbalance Highlighting
Spot key market aggressiveness with imbalance detection:
- Imbalance ratio highlights price levels where aggressive buyers or sellers dominate. An imbalance is triggered when the buy/sell volume on one side is at least 1.5 times (by default but you can change according to your strategy) larger than the opposite side, revealing strong directional pressure in the order flow.
- Highlight stacked imbalances automatically
- Control opacity, colors, and text appearance

📛 Imbalance Zones
Automatically highlight potential support and resistance created by multiple consecutive imbalances:
- Customize the # of levels, volume filter, and colors
- Adjust zone opacity for easy visual layering


🕯 Mini Candles
Overlay small candlesticks to help align footprint activity with actual price action:
- Set candlestick style, width, offset
- Customize bullish/bearish colors and wick color

🚀 Performance
Ensure smooth rendering by limiting the number of price levels displayed.
Max Price Levels: Control how many individual price levels are shown on the chart. Default is 200.

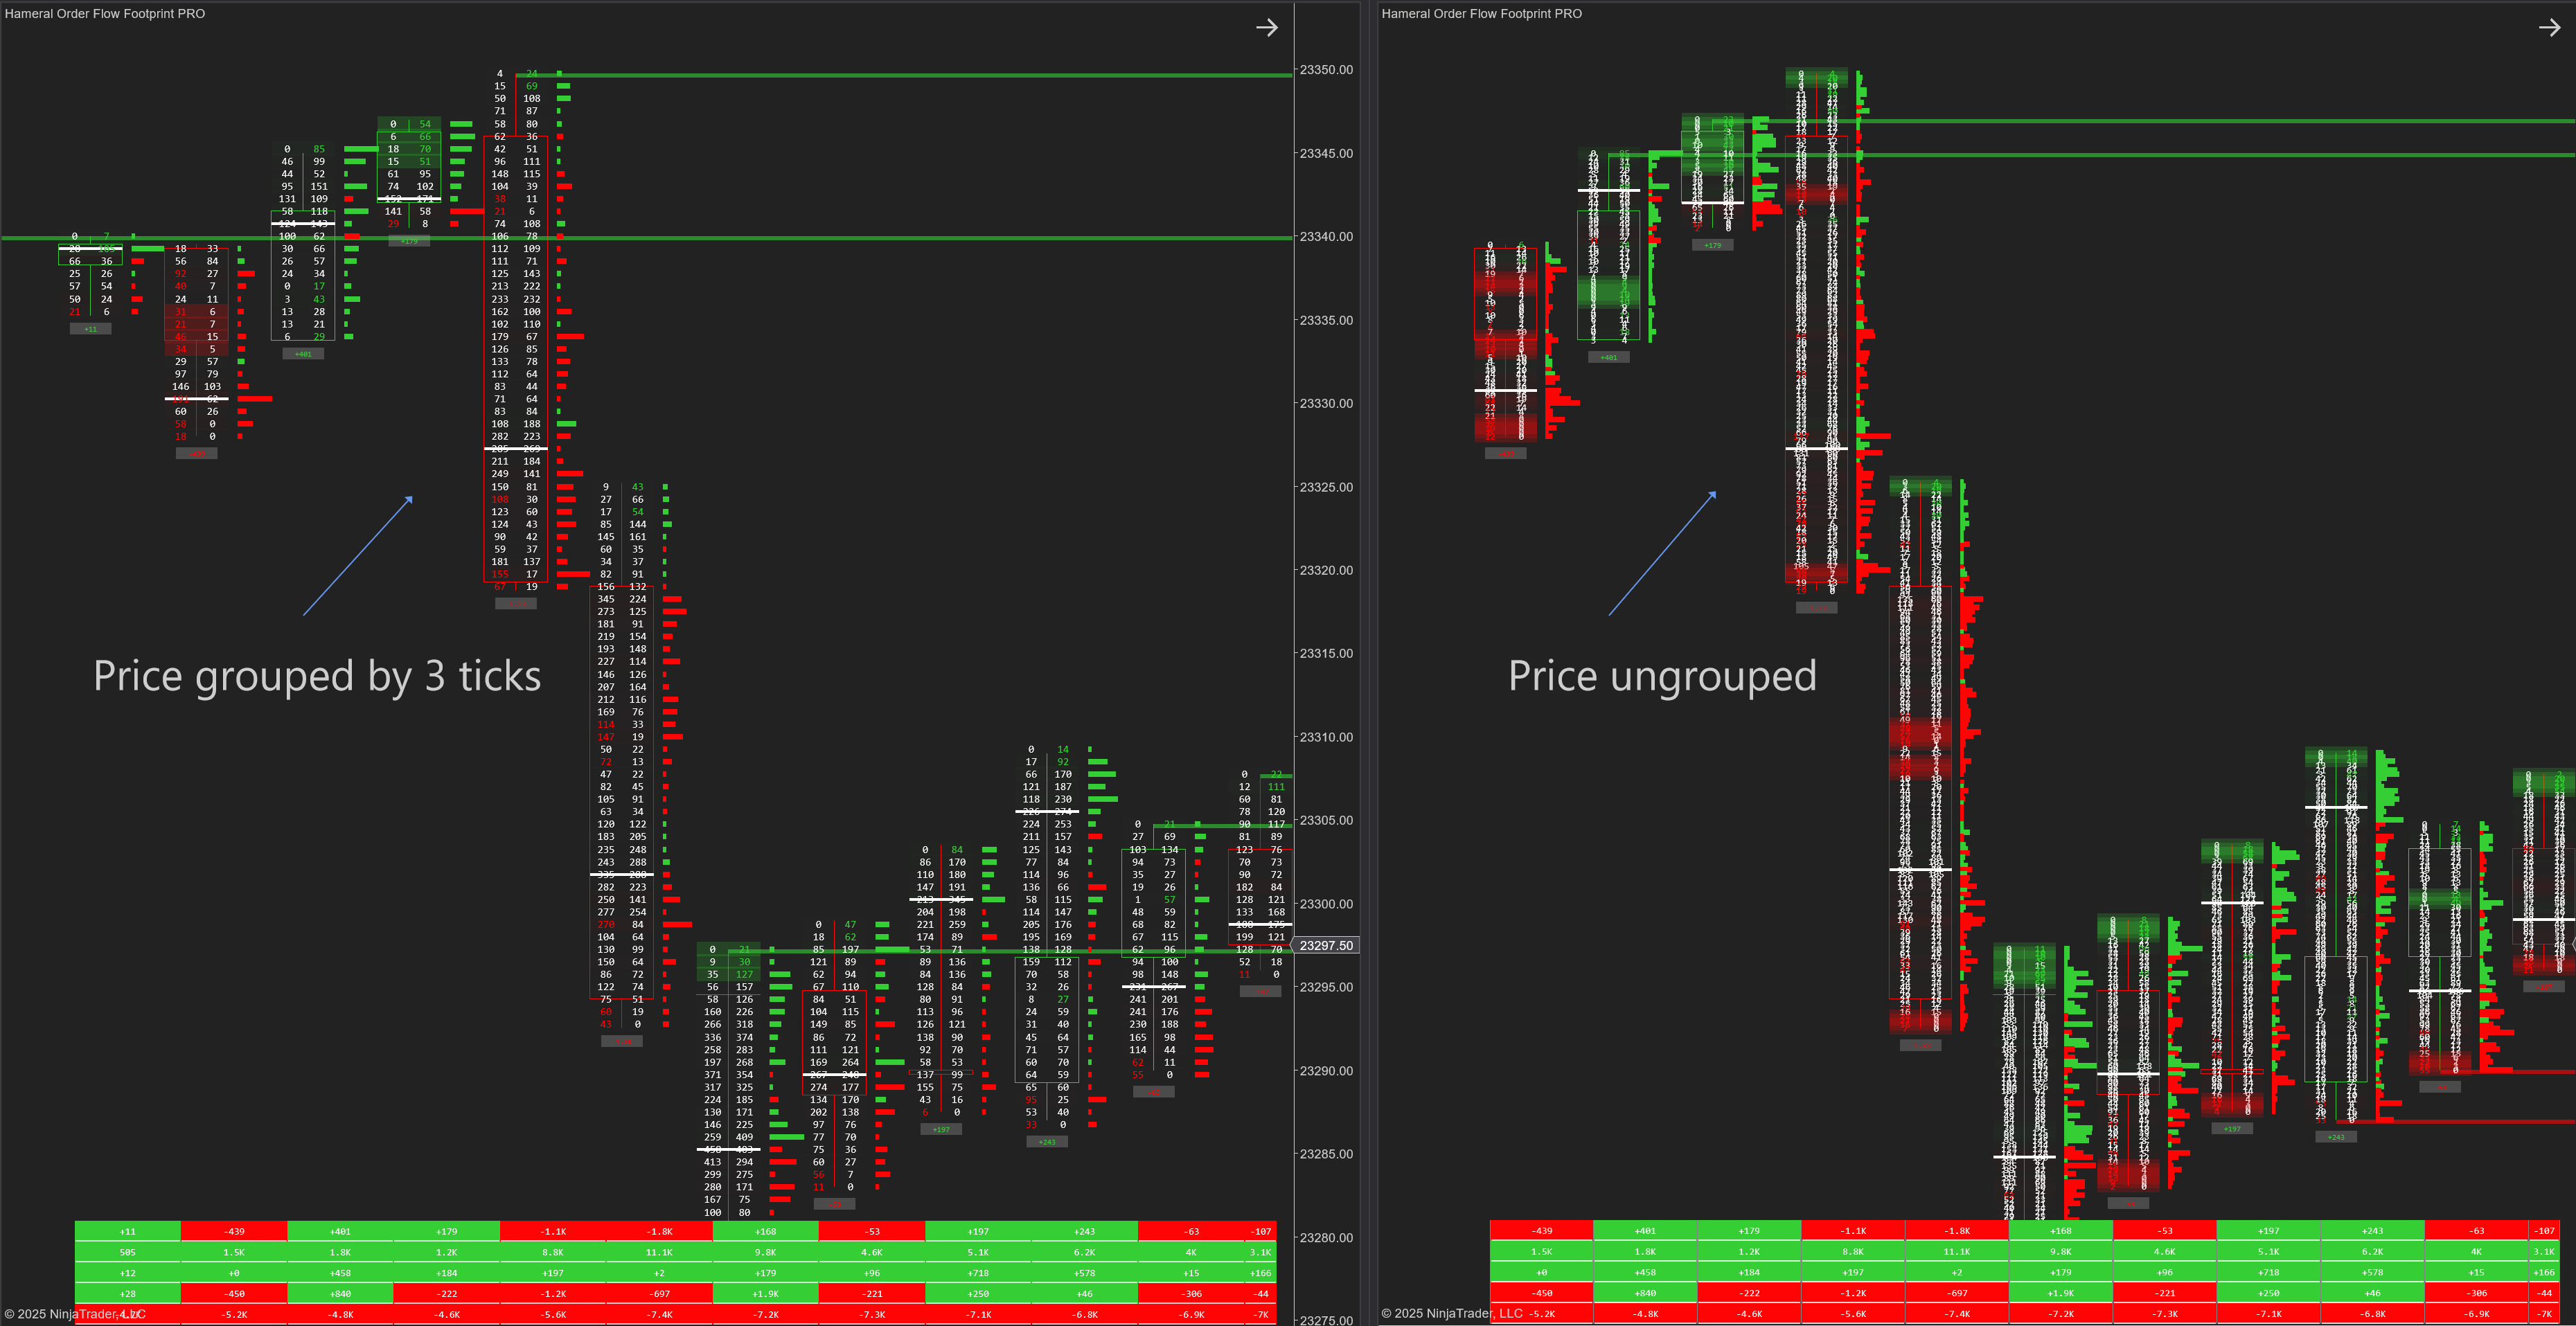
📊 Price Grouping
Easily group prices into custom tick sizes for cleaner and more aggregated visualization.
Purpose: Combines multiple price levels into a single row for a cleaner, more readable footprint.
Instead of showing every single tick (1-point increment), it combines them into larger blocks – like 2-tick, 4-tick, or 1-point intervals.
Grouped footprints help you focus on the areas where institutional orders cluster — especially in futures like CL, GC, or crypto.
Enable Price Grouping: Toggle grouping on/off.
Custom Tick Multiplier: Define the grouping precision (e.g., 1 tick, 2 ticks, etc.).

🔢 Total Delta Display
Track the cumulative delta at the bottom of each footprint bar for a complete view of buy/sell pressure.
Show Total Delta: Enable a summary delta value under each bar.
Delta Offset & Font: Customize spacing and text size for readability.
Color Coding: LimeGreen for positive, Red for negative.

📘 How to Use It
The Hameral Footprint PRO is designed to offer maximum control over order flow reading. You can customize what data is displayed inside each candle, whether you want to see raw volume, delta values, absorption zones, imbalance highlights, or detailed session stats. It works best when combined with:
- 🔍 Imbalance Highlighting to detect aggressive market orders
- 🧲 Absorption Zones to reveal passive limit order activity
- 📊 Delta Panel and Histogram for momentum confirmation
This indicator is most powerful on lower timeframes (e.g., 1-minute, 3-range, 8-tick) for scalping or high-precision entries, but it also provides valuable insight on higher timeframes when analyzing accumulation or distribution.
⚠️ Important Warning
Because this indicator displays deep order flow and real-time trade activity, settings must be adjusted per instrument. Each market (NQ, ES, CL, GC, etc.) has its own volume behavior and volatility profile. Test different combinations of:
📌 Imbalance Ratio & Volume Filter
📌 Absorption Percent & Depth
📌 Font size, opacity, and volume filters
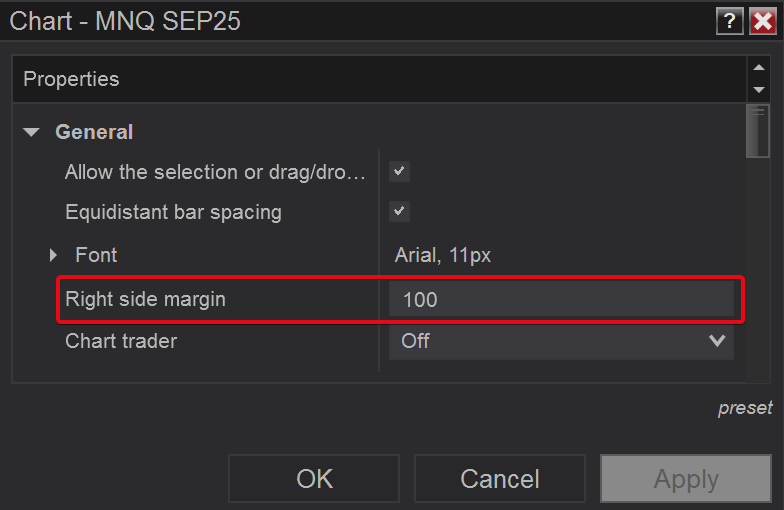
If you want to see the table text better, increase the right side margin.
Right click on the chart -> Properties -> Right side margin
🛠️ How to Install it in NinjaTrader 8
- Download the pack: HameralOrderFlowIndicatorsPRO.zip
- In NinjaTrader, go to Tools → Import → NinjaScript Add-On
- Select the ZIP file and click Open
- Restart NinjaTrader 8
- Right-click chart → Indicators → Search “Hameral”
- Add it to your chart and customize it
📥 Get The Order Flow Basic Pack For FREE
Just sign up for our newsletter and get the full Hameral Basic Order Flow Pack instantly. This includes:
- ✅ Volume Profile Basic
- ✅ VWAP Basic
- ✅ Delta Bars Basic
- ✅ Footprint Basic
- 🎁 Bonus: Super Oscillator + Trading Template
💼 Need Advanced Order Flow Tools?
Looking for more flexibility and institutional-grade control? You’ll love the Hameral Pro Order Flow Pack, which includes:
- 📊 Session-by-session & Multi-Timeframe Volume Profiles
- 📌 Anchored Volume Profile
- 📈 Multi-Session VWAP with Standard Deviation Bands
- 📍 Anchored VWAP
- 📉 Cumulative Delta
- 🕯️ Advanced Footprint Chart — visualize order flow inside each candle, including absorption, delta, and more
- ⚡ Super Oscillator PRO with Market Extension Trigger